

370
9 Bioenergetics
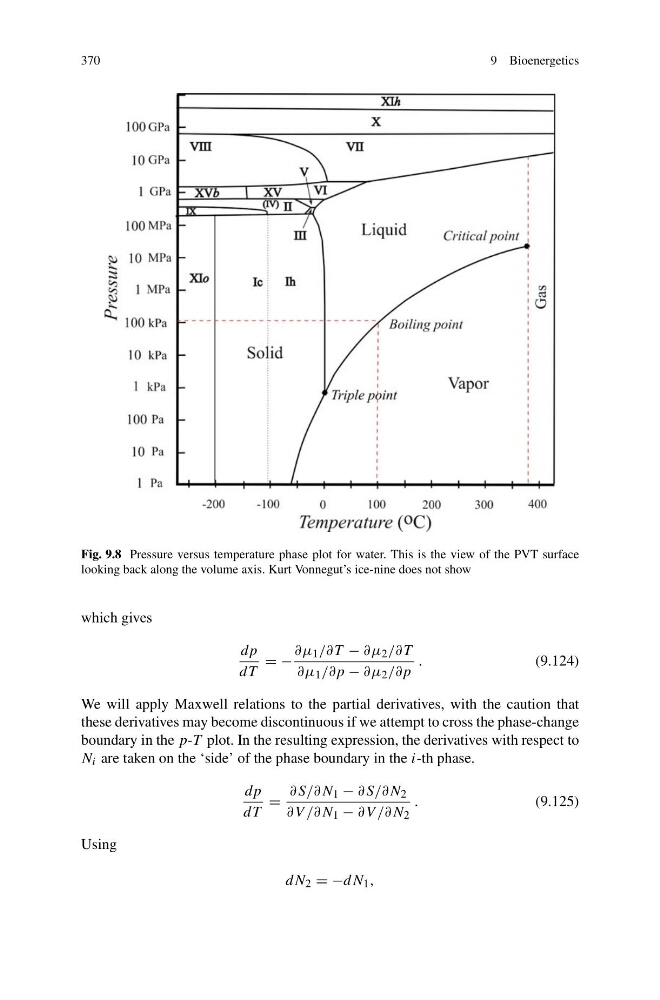
Fig. 9.8 Pressure versus temperature phase plot for water. This is the view of the PVT surface
looking back along the volume axis. Kurt Vonnegut’s ice-nine does not show
which gives
dp
dT
= −
∂μ 1 /∂T − ∂μ 2 /∂T
∂μ 1 /∂p − ∂μ 2 /∂p
.
(9.124)
We will apply Maxwell relations to the partial derivatives, with the caution that
these derivatives may become discontinuous if we attempt to cross the phase-change
boundary in the p-T plot. In the resulting expression, the derivatives with respect to
N i are taken on the ‘side’ of the phase boundary in the i-th phase.
dp
dT
=
∂S/∂N 1 − ∂S/∂N 2
∂V /∂N 1 − ∂V /∂N 2
.
(9.125)
Using
dN 2 = −dN 1 ,
9 Bioenergetics
Fig. 9.8 Pressure versus temperature phase plot for water. This is the view of the PVT surface
looking back along the volume axis. Kurt Vonnegut’s ice-nine does not show
which gives
dp
dT
= −
∂μ 1 /∂T − ∂μ 2 /∂T
∂μ 1 /∂p − ∂μ 2 /∂p
.
(9.124)
We will apply Maxwell relations to the partial derivatives, with the caution that
these derivatives may become discontinuous if we attempt to cross the phase-change
boundary in the p-T plot. In the resulting expression, the derivatives with respect to
N i are taken on the ‘side’ of the phase boundary in the i-th phase.
dp
dT
=
∂S/∂N 1 − ∂S/∂N 2
∂V /∂N 1 − ∂V /∂N 2
.
(9.125)
Using
dN 2 = −dN 1 ,