

Machine Learning Predictions of Adsorption Energies …
141
2.3 ML Prediction of Adsorption Energies
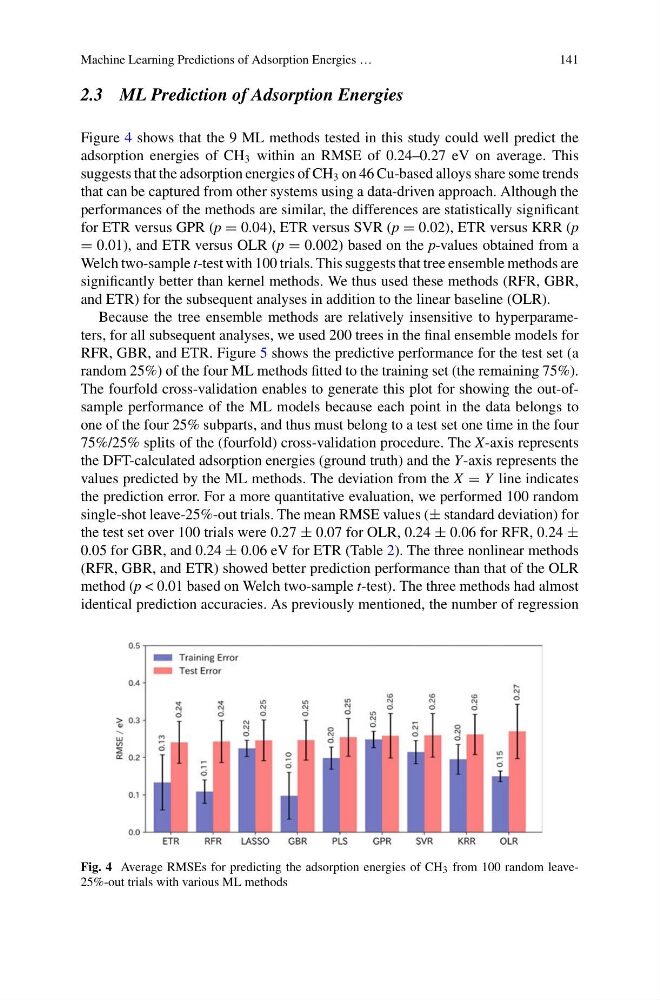
Figure 4 shows that the 9 ML methods tested in this study could well predict the
adsorption energies of CH 3 within an RMSE of 0.24–0.27 eV on average. This
suggests that the adsorption energies of CH 3 on 46 Cu-based alloys share some trends
that can be captured from other systems using a data-driven approach. Although the
performances of the methods are similar, the differences are statistically significant
for ETR versus GPR (p = 0.04), ETR versus SVR (p = 0.02), ETR versus KRR (p
= 0.01), and ETR versus OLR (p = 0.002) based on the p-values obtained from a
Welch two-sample t-test with 100 trials. This suggests that tree ensemble methods are
significantly better than kernel methods. We thus used these methods (RFR, GBR,
and ETR) for the subsequent analyses in addition to the linear baseline (OLR).
Because the tree ensemble methods are relatively insensitive to hyperparameters, for all subsequent analyses, we used 200 trees in the final ensemble models for
RFR, GBR, and ETR. Figure 5 shows the predictive performance for the test set (a
random 25%) of the four ML methods fitted to the training set (the remaining 75%).
The fourfold cross-validation enables to generate this plot for showing the out-ofsample performance of the ML models because each point in the data belongs to
one of the four 25% subparts, and thus must belong to a test set one time in the four
75%/25% splits of the (fourfold) cross-validation procedure. The X-axis represents
the DFT-calculated adsorption energies (ground truth) and the Y-axis represents the
values predicted by the ML methods. The deviation from the X = Y line indicates
the prediction error. For a more quantitative evaluation, we performed 100 random
single-shot leave-25%-out trials. The mean RMSE values (± standard deviation) for
the test set over 100 trials were 0.27 ± 0.07 for OLR, 0.24 ± 0.06 for RFR, 0.24 ±
0.05 for GBR, and 0.24 ± 0.06 eV for ETR (Table 2). The three nonlinear methods
(RFR, GBR, and ETR) showed better prediction performance than that of the OLR
method (p < 0.01 based on Welch two-sample t-test). The three methods had almost
identical prediction accuracies. As previously mentioned, the number of regression
Fig. 4 Average RMSEs for predicting the adsorption energies of CH 3 from 100 random leave25%-out trials with various ML methods
141
2.3 ML Prediction of Adsorption Energies
Figure 4 shows that the 9 ML methods tested in this study could well predict the
adsorption energies of CH 3 within an RMSE of 0.24–0.27 eV on average. This
suggests that the adsorption energies of CH 3 on 46 Cu-based alloys share some trends
that can be captured from other systems using a data-driven approach. Although the
performances of the methods are similar, the differences are statistically significant
for ETR versus GPR (p = 0.04), ETR versus SVR (p = 0.02), ETR versus KRR (p
= 0.01), and ETR versus OLR (p = 0.002) based on the p-values obtained from a
Welch two-sample t-test with 100 trials. This suggests that tree ensemble methods are
significantly better than kernel methods. We thus used these methods (RFR, GBR,
and ETR) for the subsequent analyses in addition to the linear baseline (OLR).
Because the tree ensemble methods are relatively insensitive to hyperparameters, for all subsequent analyses, we used 200 trees in the final ensemble models for
RFR, GBR, and ETR. Figure 5 shows the predictive performance for the test set (a
random 25%) of the four ML methods fitted to the training set (the remaining 75%).
The fourfold cross-validation enables to generate this plot for showing the out-ofsample performance of the ML models because each point in the data belongs to
one of the four 25% subparts, and thus must belong to a test set one time in the four
75%/25% splits of the (fourfold) cross-validation procedure. The X-axis represents
the DFT-calculated adsorption energies (ground truth) and the Y-axis represents the
values predicted by the ML methods. The deviation from the X = Y line indicates
the prediction error. For a more quantitative evaluation, we performed 100 random
single-shot leave-25%-out trials. The mean RMSE values (± standard deviation) for
the test set over 100 trials were 0.27 ± 0.07 for OLR, 0.24 ± 0.06 for RFR, 0.24 ±
0.05 for GBR, and 0.24 ± 0.06 eV for ETR (Table 2). The three nonlinear methods
(RFR, GBR, and ETR) showed better prediction performance than that of the OLR
method (p < 0.01 based on Welch two-sample t-test). The three methods had almost
identical prediction accuracies. As previously mentioned, the number of regression
Fig. 4 Average RMSEs for predicting the adsorption energies of CH 3 from 100 random leave25%-out trials with various ML methods