

140
T. Toyao et al.
Evaluations for selecting ML methods were performed with a set of 9 widely
used ML methods from three major categories: linear methods for linear regression, kernel methods, and tree ensemble methods for nonlinear regression. Linear
methods assume linearity between the prediction target and descriptors but give the
most stable baseline for prediction performance. We tested ordinary linear regression
(OLR) by least squares, partial least squares (PLS) regression with automatic dimensionality reduction, and least absolute shrinkage and selection operator (LASSO)
regression with automatic descriptor selection. For kernel methods, we tested kernel
ridge regression (KRR), support vector regression (SVR), and Gaussian process
regression (GPR). For tree ensemble methods, we tested random forest regression
(RFR), gradient boosting regression (GBR), and extra trees regression (ETR).
To evaluate the predictive capability of the ML models, we used Monte Carlo
cross-validation with 100 random leave-25%-out trials for evaluating the prediction performance for the adsorption energies of CH 3 . All ML methods used the 12
descriptors as input. The RMSE of the difference between the predicted values and
the ground truth values was calculated for each trial and averaged to obtain the mean
RMSE values and their standard deviations. For most ML methods, users need to
appropriately set the values of hyperparameters, which critically impact prediction
performance. We extensively tested (grid search) a reasonable range of candidate
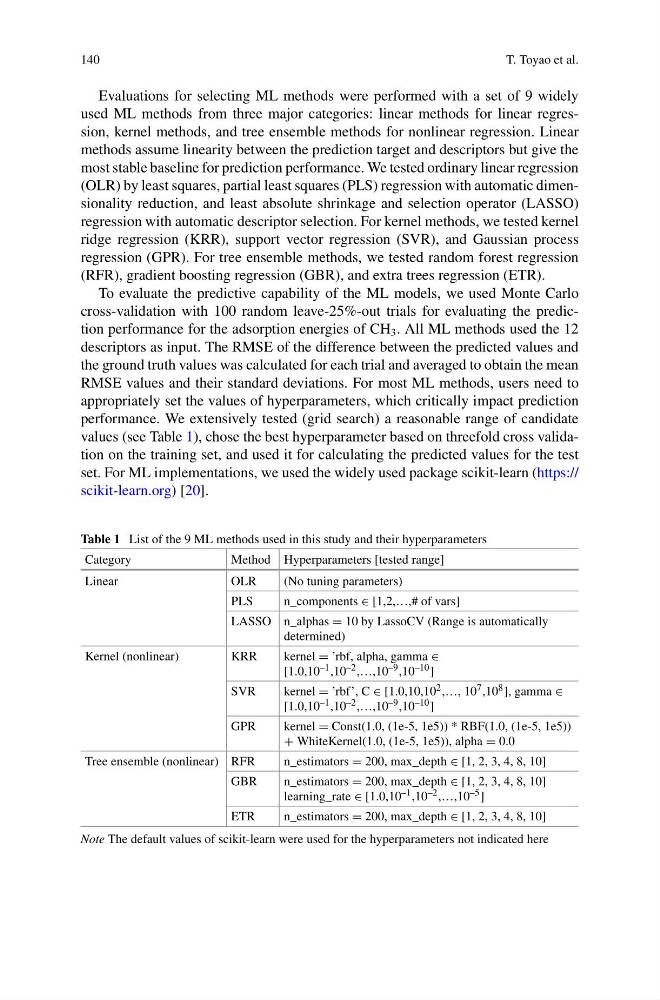
values (see Table 1), chose the best hyperparameter based on threefold cross validation on the training set, and used it for calculating the predicted values for the test
set. For ML implementations, we used the widely used package scikit-learn (https://
scikit-learn.org) [20].
Table 1 List of the 9 ML methods used in this study and their hyperparameters
Category
Method Hyperparameters [tested range]
Linear
OLR
(No tuning parameters)
PLS
n_components ∈ [1,2,…,# of vars]
LASSO n_alphas = 10 by LassoCV (Range is automatically
determined)
Kernel (nonlinear)
KRR
kernel = ’rbf, alpha, gamma ∈
[1.0,10 –1 ,10 –2 ,…,10 –9 ,10 –10 ]
SVR
kernel = ’rbf’, C ∈ [1.0,10,10 2 ,…, 10 7 ,10 8 ], gamma ∈
[1.0,10 –1 ,10 –2 ,…,10 –9 ,10 –10 ]
GPR
kernel = Const(1.0, (1e-5, 1e5)) * RBF(1.0, (1e-5, 1e5))
+ WhiteKernel(1.0, (1e-5, 1e5)), alpha = 0.0
Tree ensemble (nonlinear) RFR
n_estimators = 200, max_depth ∈ [1, 2, 3, 4, 8, 10]
GBR
n_estimators = 200, max_depth ∈ [1, 2, 3, 4, 8, 10]
learning_rate ∈ [1.0,10 –1 ,10 –2 ,…,10 –5 ]
ETR
n_estimators = 200, max_depth ∈ [1, 2, 3, 4, 8, 10]
Note The default values of scikit-learn were used for the hyperparameters not indicated here
T. Toyao et al.
Evaluations for selecting ML methods were performed with a set of 9 widely
used ML methods from three major categories: linear methods for linear regression, kernel methods, and tree ensemble methods for nonlinear regression. Linear
methods assume linearity between the prediction target and descriptors but give the
most stable baseline for prediction performance. We tested ordinary linear regression
(OLR) by least squares, partial least squares (PLS) regression with automatic dimensionality reduction, and least absolute shrinkage and selection operator (LASSO)
regression with automatic descriptor selection. For kernel methods, we tested kernel
ridge regression (KRR), support vector regression (SVR), and Gaussian process
regression (GPR). For tree ensemble methods, we tested random forest regression
(RFR), gradient boosting regression (GBR), and extra trees regression (ETR).
To evaluate the predictive capability of the ML models, we used Monte Carlo
cross-validation with 100 random leave-25%-out trials for evaluating the prediction performance for the adsorption energies of CH 3 . All ML methods used the 12
descriptors as input. The RMSE of the difference between the predicted values and
the ground truth values was calculated for each trial and averaged to obtain the mean
RMSE values and their standard deviations. For most ML methods, users need to
appropriately set the values of hyperparameters, which critically impact prediction
performance. We extensively tested (grid search) a reasonable range of candidate
values (see Table 1), chose the best hyperparameter based on threefold cross validation on the training set, and used it for calculating the predicted values for the test
set. For ML implementations, we used the widely used package scikit-learn (https://
scikit-learn.org) [20].
Table 1 List of the 9 ML methods used in this study and their hyperparameters
Category
Method Hyperparameters [tested range]
Linear
OLR
(No tuning parameters)
PLS
n_components ∈ [1,2,…,# of vars]
LASSO n_alphas = 10 by LassoCV (Range is automatically
determined)
Kernel (nonlinear)
KRR
kernel = ’rbf, alpha, gamma ∈
[1.0,10 –1 ,10 –2 ,…,10 –9 ,10 –10 ]
SVR
kernel = ’rbf’, C ∈ [1.0,10,10 2 ,…, 10 7 ,10 8 ], gamma ∈
[1.0,10 –1 ,10 –2 ,…,10 –9 ,10 –10 ]
GPR
kernel = Const(1.0, (1e-5, 1e5)) * RBF(1.0, (1e-5, 1e5))
+ WhiteKernel(1.0, (1e-5, 1e5)), alpha = 0.0
Tree ensemble (nonlinear) RFR
n_estimators = 200, max_depth ∈ [1, 2, 3, 4, 8, 10]
GBR
n_estimators = 200, max_depth ∈ [1, 2, 3, 4, 8, 10]
learning_rate ∈ [1.0,10 –1 ,10 –2 ,…,10 –5 ]
ETR
n_estimators = 200, max_depth ∈ [1, 2, 3, 4, 8, 10]
Note The default values of scikit-learn were used for the hyperparameters not indicated here