

138
T. Toyao et al.
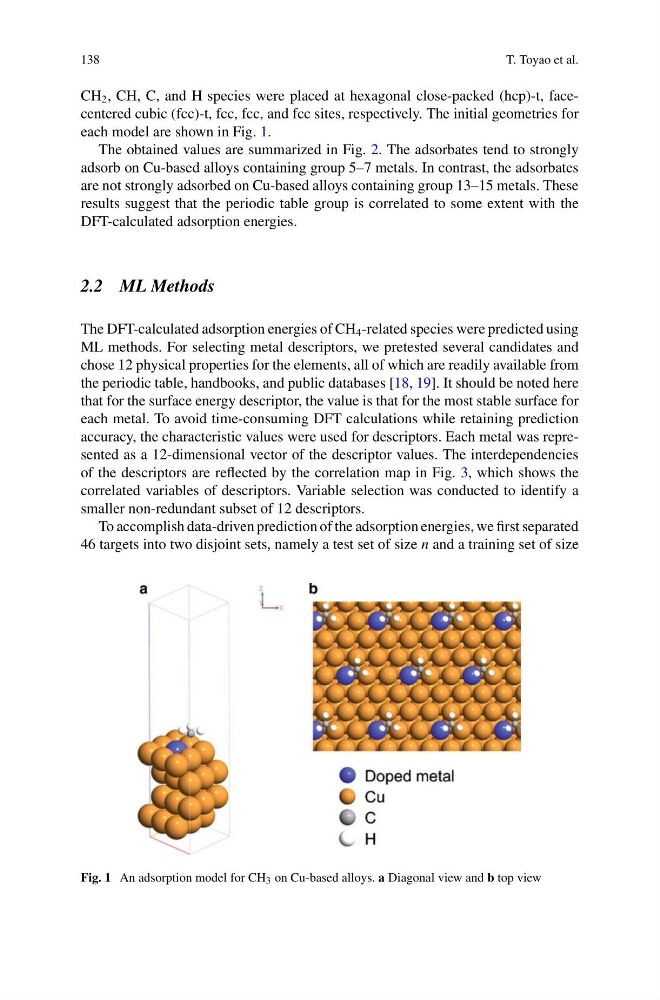
CH 2 , CH, C, and H species were placed at hexagonal close-packed (hcp)-t, facecentered cubic (fcc)-t, fcc, fcc, and fcc sites, respectively. The initial geometries for
each model are shown in Fig. 1.
The obtained values are summarized in Fig. 2. The adsorbates tend to strongly
adsorb on Cu-based alloys containing group 5–7 metals. In contrast, the adsorbates
are not strongly adsorbed on Cu-based alloys containing group 13–15 metals. These
results suggest that the periodic table group is correlated to some extent with the
DFT-calculated adsorption energies.
2.2 ML Methods
The DFT-calculated adsorption energies of CH 4 -related species were predicted using
ML methods. For selecting metal descriptors, we pretested several candidates and
chose 12 physical properties for the elements, all of which are readily available from
the periodic table, handbooks, and public databases [18, 19]. It should be noted here
that for the surface energy descriptor, the value is that for the most stable surface for
each metal. To avoid time-consuming DFT calculations while retaining prediction
accuracy, the characteristic values were used for descriptors. Each metal was represented as a 12-dimensional vector of the descriptor values. The interdependencies
of the descriptors are reflected by the correlation map in Fig. 3, which shows the
correlated variables of descriptors. Variable selection was conducted to identify a
smaller non-redundant subset of 12 descriptors.
To accomplish data-driven prediction of the adsorption energies, we first separated
46 targets into two disjoint sets, namely a test set of size n and a training set of size
Fig. 1 An adsorption model for CH 3 on Cu-based alloys. a Diagonal view and b top view
T. Toyao et al.
CH 2 , CH, C, and H species were placed at hexagonal close-packed (hcp)-t, facecentered cubic (fcc)-t, fcc, fcc, and fcc sites, respectively. The initial geometries for
each model are shown in Fig. 1.
The obtained values are summarized in Fig. 2. The adsorbates tend to strongly
adsorb on Cu-based alloys containing group 5–7 metals. In contrast, the adsorbates
are not strongly adsorbed on Cu-based alloys containing group 13–15 metals. These
results suggest that the periodic table group is correlated to some extent with the
DFT-calculated adsorption energies.
2.2 ML Methods
The DFT-calculated adsorption energies of CH 4 -related species were predicted using
ML methods. For selecting metal descriptors, we pretested several candidates and
chose 12 physical properties for the elements, all of which are readily available from
the periodic table, handbooks, and public databases [18, 19]. It should be noted here
that for the surface energy descriptor, the value is that for the most stable surface for
each metal. To avoid time-consuming DFT calculations while retaining prediction
accuracy, the characteristic values were used for descriptors. Each metal was represented as a 12-dimensional vector of the descriptor values. The interdependencies
of the descriptors are reflected by the correlation map in Fig. 3, which shows the
correlated variables of descriptors. Variable selection was conducted to identify a
smaller non-redundant subset of 12 descriptors.
To accomplish data-driven prediction of the adsorption energies, we first separated
46 targets into two disjoint sets, namely a test set of size n and a training set of size
Fig. 1 An adsorption model for CH 3 on Cu-based alloys. a Diagonal view and b top view