

128
Y. Tsuji et al.
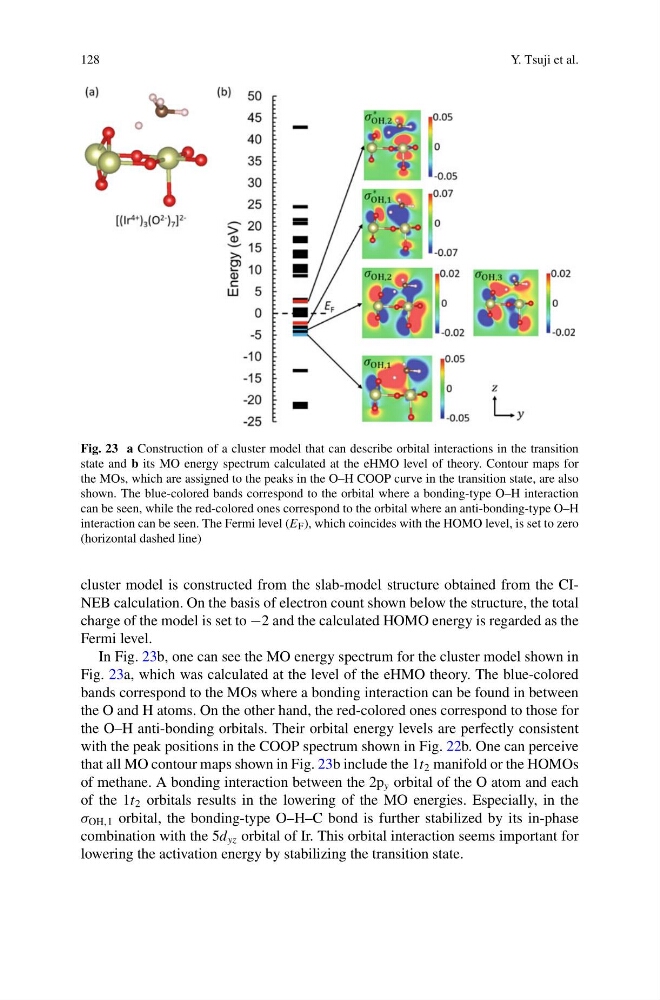
Fig. 23 a Construction of a cluster model that can describe orbital interactions in the transition
state and b its MO energy spectrum calculated at the eHMO level of theory. Contour maps for
the MOs, which are assigned to the peaks in the O–H COOP curve in the transition state, are also
shown. The blue-colored bands correspond to the orbital where a bonding-type O–H interaction
can be seen, while the red-colored ones correspond to the orbital where an anti-bonding-type O–H
interaction can be seen. The Fermi level (E F ), which coincides with the HOMO level, is set to zero
(horizontal dashed line)
cluster model is constructed from the slab-model structure obtained from the CINEB calculation. On the basis of electron count shown below the structure, the total
charge of the model is set to −2 and the calculated HOMO energy is regarded as the
Fermi level.
In Fig. 23b, one can see the MO energy spectrum for the cluster model shown in
Fig. 23a, which was calculated at the level of the eHMO theory. The blue-colored
bands correspond to the MOs where a bonding interaction can be found in between
the O and H atoms. On the other hand, the red-colored ones correspond to those for
the O–H anti-bonding orbitals. Their orbital energy levels are perfectly consistent
with the peak positions in the COOP spectrum shown in Fig. 22b. One can perceive
that all MO contour maps shown in Fig. 23b include the 1t 2 manifold or the HOMOs
of methane. A bonding interaction between the 2p y orbital of the O atom and each
of the 1t 2 orbitals results in the lowering of the MO energies. Especially, in the
σ OH,1 orbital, the bonding-type O–H–C bond is further stabilized by its in-phase
combination with the 5d yz orbital of Ir. This orbital interaction seems important for
lowering the activation energy by stabilizing the transition state.
Y. Tsuji et al.
Fig. 23 a Construction of a cluster model that can describe orbital interactions in the transition
state and b its MO energy spectrum calculated at the eHMO level of theory. Contour maps for
the MOs, which are assigned to the peaks in the O–H COOP curve in the transition state, are also
shown. The blue-colored bands correspond to the orbital where a bonding-type O–H interaction
can be seen, while the red-colored ones correspond to the orbital where an anti-bonding-type O–H
interaction can be seen. The Fermi level (E F ), which coincides with the HOMO level, is set to zero
(horizontal dashed line)
cluster model is constructed from the slab-model structure obtained from the CINEB calculation. On the basis of electron count shown below the structure, the total
charge of the model is set to −2 and the calculated HOMO energy is regarded as the
Fermi level.
In Fig. 23b, one can see the MO energy spectrum for the cluster model shown in
Fig. 23a, which was calculated at the level of the eHMO theory. The blue-colored
bands correspond to the MOs where a bonding interaction can be found in between
the O and H atoms. On the other hand, the red-colored ones correspond to those for
the O–H anti-bonding orbitals. Their orbital energy levels are perfectly consistent
with the peak positions in the COOP spectrum shown in Fig. 22b. One can perceive
that all MO contour maps shown in Fig. 23b include the 1t 2 manifold or the HOMOs
of methane. A bonding interaction between the 2p y orbital of the O atom and each
of the 1t 2 orbitals results in the lowering of the MO energies. Especially, in the
σ OH,1 orbital, the bonding-type O–H–C bond is further stabilized by its in-phase
combination with the 5d yz orbital of Ir. This orbital interaction seems important for
lowering the activation energy by stabilizing the transition state.