

Dynamics and Energetics of Methane …
127
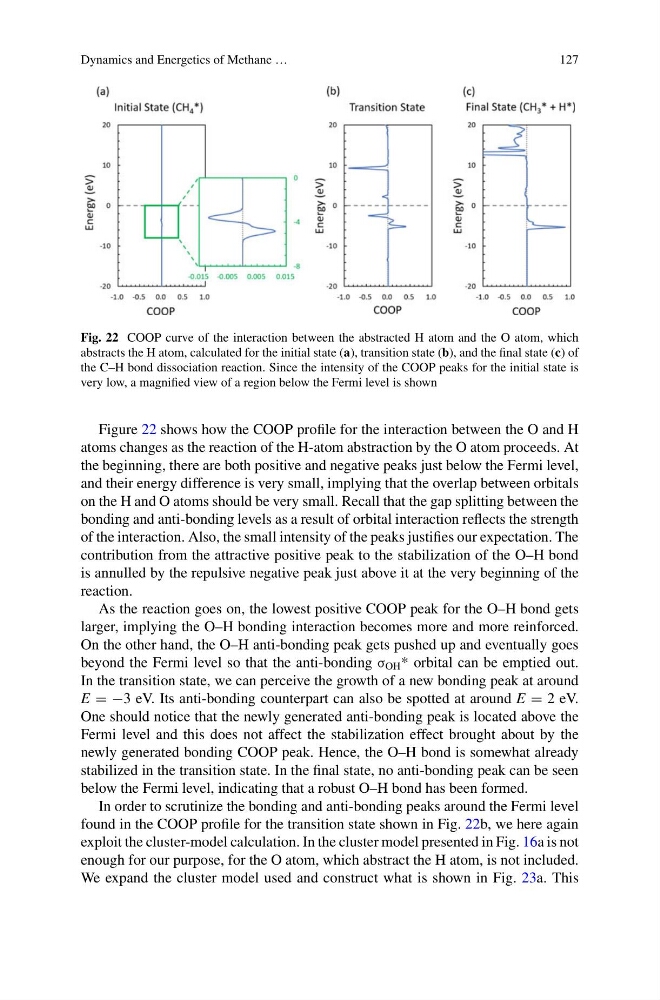
Fig. 22 COOP curve of the interaction between the abstracted H atom and the O atom, which
abstracts the H atom, calculated for the initial state (a), transition state (b), and the final state (c) of
the C–H bond dissociation reaction. Since the intensity of the COOP peaks for the initial state is
very low, a magnified view of a region below the Fermi level is shown
Figure 22 shows how the COOP profile for the interaction between the O and H
atoms changes as the reaction of the H-atom abstraction by the O atom proceeds. At
the beginning, there are both positive and negative peaks just below the Fermi level,
and their energy difference is very small, implying that the overlap between orbitals
on the H and O atoms should be very small. Recall that the gap splitting between the
bonding and anti-bonding levels as a result of orbital interaction reflects the strength
of the interaction. Also, the small intensity of the peaks justifies our expectation. The
contribution from the attractive positive peak to the stabilization of the O–H bond
is annulled by the repulsive negative peak just above it at the very beginning of the
reaction.
As the reaction goes on, the lowest positive COOP peak for the O–H bond gets
larger, implying the O–H bonding interaction becomes more and more reinforced.
On the other hand, the O–H anti-bonding peak gets pushed up and eventually goes
beyond the Fermi level so that the anti-bonding σ OH * orbital can be emptied out.
In the transition state, we can perceive the growth of a new bonding peak at around
E = −3 eV. Its anti-bonding counterpart can also be spotted at around E = 2 eV.
One should notice that the newly generated anti-bonding peak is located above the
Fermi level and this does not affect the stabilization effect brought about by the
newly generated bonding COOP peak. Hence, the O–H bond is somewhat already
stabilized in the transition state. In the final state, no anti-bonding peak can be seen
below the Fermi level, indicating that a robust O–H bond has been formed.
In order to scrutinize the bonding and anti-bonding peaks around the Fermi level
found in the COOP profile for the transition state shown in Fig. 22b, we here again
exploit the cluster-model calculation. In the cluster model presented in Fig. 16a is not
enough for our purpose, for the O atom, which abstract the H atom, is not included.
We expand the cluster model used and construct what is shown in Fig. 23a. This
127
Fig. 22 COOP curve of the interaction between the abstracted H atom and the O atom, which
abstracts the H atom, calculated for the initial state (a), transition state (b), and the final state (c) of
the C–H bond dissociation reaction. Since the intensity of the COOP peaks for the initial state is
very low, a magnified view of a region below the Fermi level is shown
Figure 22 shows how the COOP profile for the interaction between the O and H
atoms changes as the reaction of the H-atom abstraction by the O atom proceeds. At
the beginning, there are both positive and negative peaks just below the Fermi level,
and their energy difference is very small, implying that the overlap between orbitals
on the H and O atoms should be very small. Recall that the gap splitting between the
bonding and anti-bonding levels as a result of orbital interaction reflects the strength
of the interaction. Also, the small intensity of the peaks justifies our expectation. The
contribution from the attractive positive peak to the stabilization of the O–H bond
is annulled by the repulsive negative peak just above it at the very beginning of the
reaction.
As the reaction goes on, the lowest positive COOP peak for the O–H bond gets
larger, implying the O–H bonding interaction becomes more and more reinforced.
On the other hand, the O–H anti-bonding peak gets pushed up and eventually goes
beyond the Fermi level so that the anti-bonding σ OH * orbital can be emptied out.
In the transition state, we can perceive the growth of a new bonding peak at around
E = −3 eV. Its anti-bonding counterpart can also be spotted at around E = 2 eV.
One should notice that the newly generated anti-bonding peak is located above the
Fermi level and this does not affect the stabilization effect brought about by the
newly generated bonding COOP peak. Hence, the O–H bond is somewhat already
stabilized in the transition state. In the final state, no anti-bonding peak can be seen
below the Fermi level, indicating that a robust O–H bond has been formed.
In order to scrutinize the bonding and anti-bonding peaks around the Fermi level
found in the COOP profile for the transition state shown in Fig. 22b, we here again
exploit the cluster-model calculation. In the cluster model presented in Fig. 16a is not
enough for our purpose, for the O atom, which abstract the H atom, is not included.
We expand the cluster model used and construct what is shown in Fig. 23a. This