

126
Y. Tsuji et al.
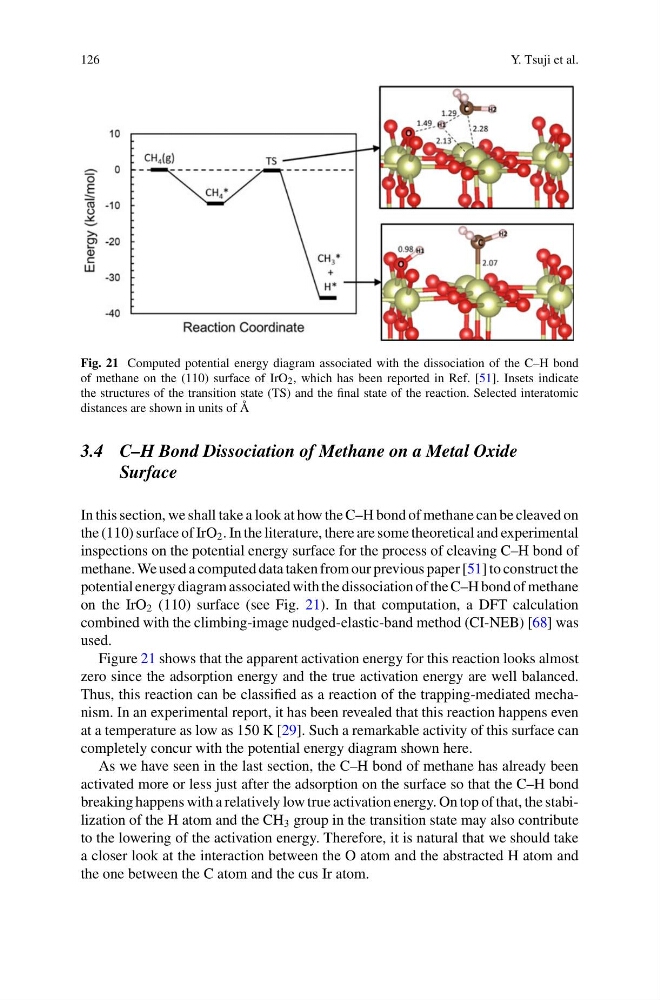
Fig. 21 Computed potential energy diagram associated with the dissociation of the C–H bond
of methane on the (110) surface of IrO 2 , which has been reported in Ref. [51]. Insets indicate
the structures of the transition state (TS) and the final state of the reaction. Selected interatomic
distances are shown in units of Å
3.4 C–H Bond Dissociation of Methane on a Metal Oxide
Surface
In this section, we shall take a look at how the C–H bond of methane can be cleaved on
the (110) surface of IrO 2 . In the literature, there are some theoretical and experimental
inspections on the potential energy surface for the process of cleaving C–H bond of
methane. We used a computed data taken from our previous paper [51] to construct the
potential energy diagram associated with the dissociation of the C–H bond of methane
on the IrO 2 (110) surface (see Fig. 21). In that computation, a DFT calculation
combined with the climbing-image nudged-elastic-band method (CI-NEB) [68] was
used.
Figure 21 shows that the apparent activation energy for this reaction looks almost
zero since the adsorption energy and the true activation energy are well balanced.
Thus, this reaction can be classified as a reaction of the trapping-mediated mechanism. In an experimental report, it has been revealed that this reaction happens even
at a temperature as low as 150 K [29]. Such a remarkable activity of this surface can
completely concur with the potential energy diagram shown here.
As we have seen in the last section, the C–H bond of methane has already been
activated more or less just after the adsorption on the surface so that the C–H bond
breaking happens with a relatively low true activation energy. On top of that, the stabilization of the H atom and the CH 3 group in the transition state may also contribute
to the lowering of the activation energy. Therefore, it is natural that we should take
a closer look at the interaction between the O atom and the abstracted H atom and
the one between the C atom and the cus Ir atom.
Y. Tsuji et al.
Fig. 21 Computed potential energy diagram associated with the dissociation of the C–H bond
of methane on the (110) surface of IrO 2 , which has been reported in Ref. [51]. Insets indicate
the structures of the transition state (TS) and the final state of the reaction. Selected interatomic
distances are shown in units of Å
3.4 C–H Bond Dissociation of Methane on a Metal Oxide
Surface
In this section, we shall take a look at how the C–H bond of methane can be cleaved on
the (110) surface of IrO 2 . In the literature, there are some theoretical and experimental
inspections on the potential energy surface for the process of cleaving C–H bond of
methane. We used a computed data taken from our previous paper [51] to construct the
potential energy diagram associated with the dissociation of the C–H bond of methane
on the IrO 2 (110) surface (see Fig. 21). In that computation, a DFT calculation
combined with the climbing-image nudged-elastic-band method (CI-NEB) [68] was
used.
Figure 21 shows that the apparent activation energy for this reaction looks almost
zero since the adsorption energy and the true activation energy are well balanced.
Thus, this reaction can be classified as a reaction of the trapping-mediated mechanism. In an experimental report, it has been revealed that this reaction happens even
at a temperature as low as 150 K [29]. Such a remarkable activity of this surface can
completely concur with the potential energy diagram shown here.
As we have seen in the last section, the C–H bond of methane has already been
activated more or less just after the adsorption on the surface so that the C–H bond
breaking happens with a relatively low true activation energy. On top of that, the stabilization of the H atom and the CH 3 group in the transition state may also contribute
to the lowering of the activation energy. Therefore, it is natural that we should take
a closer look at the interaction between the O atom and the abstracted H atom and
the one between the C atom and the cus Ir atom.