

Dynamics and Energetics of Methane …
129
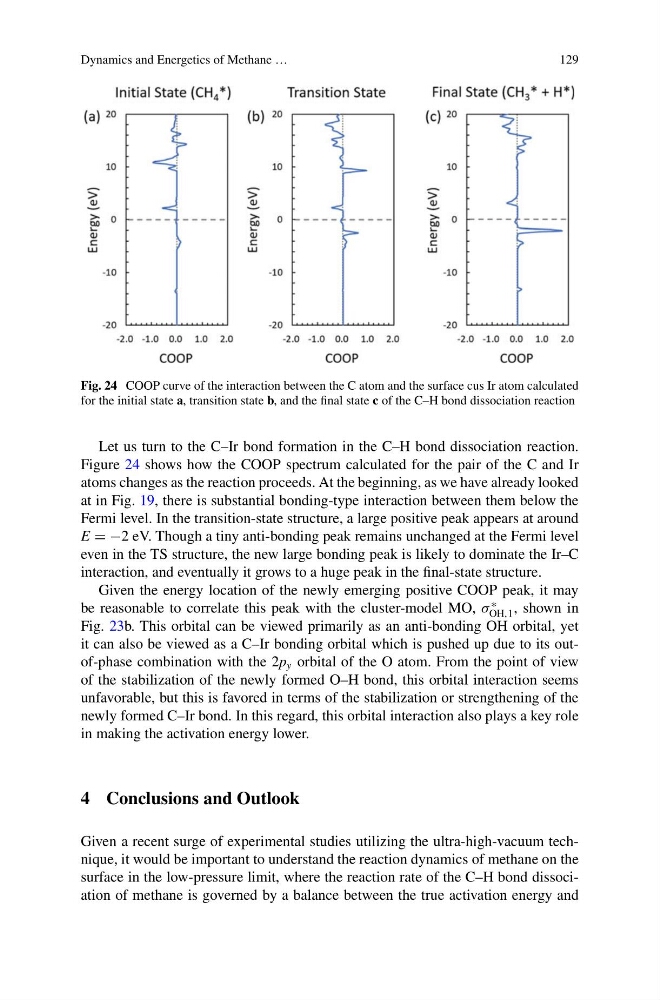
Fig. 24 COOP curve of the interaction between the C atom and the surface cus Ir atom calculated
for the initial state a, transition state b, and the final state c of the C–H bond dissociation reaction
Let us turn to the C–Ir bond formation in the C–H bond dissociation reaction.
Figure 24 shows how the COOP spectrum calculated for the pair of the C and Ir
atoms changes as the reaction proceeds. At the beginning, as we have already looked
at in Fig. 19, there is substantial bonding-type interaction between them below the
Fermi level. In the transition-state structure, a large positive peak appears at around
E = −2 eV. Though a tiny anti-bonding peak remains unchanged at the Fermi level
even in the TS structure, the new large bonding peak is likely to dominate the Ir–C
interaction, and eventually it grows to a huge peak in the final-state structure.
Given the energy location of the newly emerging positive COOP peak, it may
be reasonable to correlate this peak with the cluster-model MO, σ
∗
OH,1 , shown in
Fig. 23b. This orbital can be viewed primarily as an anti-bonding OH orbital, yet
it can also be viewed as a C–Ir bonding orbital which is pushed up due to its outof-phase combination with the 2p y orbital of the O atom. From the point of view
of the stabilization of the newly formed O–H bond, this orbital interaction seems
unfavorable, but this is favored in terms of the stabilization or strengthening of the
newly formed C–Ir bond. In this regard, this orbital interaction also plays a key role
in making the activation energy lower.
4 Conclusions and Outlook
Given a recent surge of experimental studies utilizing the ultra-high-vacuum technique, it would be important to understand the reaction dynamics of methane on the
surface in the low-pressure limit, where the reaction rate of the C–H bond dissociation of methane is governed by a balance between the true activation energy and
129
Fig. 24 COOP curve of the interaction between the C atom and the surface cus Ir atom calculated
for the initial state a, transition state b, and the final state c of the C–H bond dissociation reaction
Let us turn to the C–Ir bond formation in the C–H bond dissociation reaction.
Figure 24 shows how the COOP spectrum calculated for the pair of the C and Ir
atoms changes as the reaction proceeds. At the beginning, as we have already looked
at in Fig. 19, there is substantial bonding-type interaction between them below the
Fermi level. In the transition-state structure, a large positive peak appears at around
E = −2 eV. Though a tiny anti-bonding peak remains unchanged at the Fermi level
even in the TS structure, the new large bonding peak is likely to dominate the Ir–C
interaction, and eventually it grows to a huge peak in the final-state structure.
Given the energy location of the newly emerging positive COOP peak, it may
be reasonable to correlate this peak with the cluster-model MO, σ
∗
OH,1 , shown in
Fig. 23b. This orbital can be viewed primarily as an anti-bonding OH orbital, yet
it can also be viewed as a C–Ir bonding orbital which is pushed up due to its outof-phase combination with the 2p y orbital of the O atom. From the point of view
of the stabilization of the newly formed O–H bond, this orbital interaction seems
unfavorable, but this is favored in terms of the stabilization or strengthening of the
newly formed C–Ir bond. In this regard, this orbital interaction also plays a key role
in making the activation energy lower.
4 Conclusions and Outlook
Given a recent surge of experimental studies utilizing the ultra-high-vacuum technique, it would be important to understand the reaction dynamics of methane on the
surface in the low-pressure limit, where the reaction rate of the C–H bond dissociation of methane is governed by a balance between the true activation energy and