

Dynamics and Energetics of Methane …
119
the green-line positive and negative peaks coming, respectively, from the 1t 2x and
2t
∗
2x orbitals. One should notice that the energy level of the 2a
∗
1 orbital and that of
the degenerate 2t
∗
2 set are often switched depending on the methodology used [67].
3.3.3 Effects of Methane’s Deformation on the COOP Curve
Next, we turn to the interaction between the orbitals of methane illustrated in Fig. 12c
and the surface orbitals of IrO 2 . However, as indicated in Fig. 8, we cannot pass by
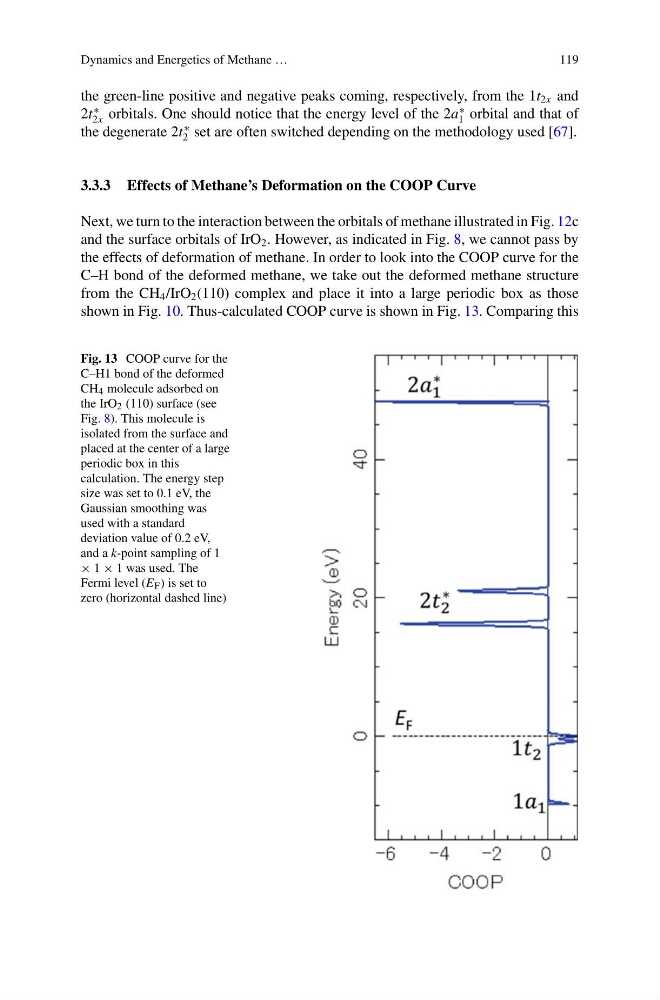
the effects of deformation of methane. In order to look into the COOP curve for the
C–H bond of the deformed methane, we take out the deformed methane structure
from the CH 4 /IrO 2 (110) complex and place it into a large periodic box as those
shown in Fig. 10. Thus-calculated COOP curve is shown in Fig. 13. Comparing this
Fig. 13 COOP curve for the
C–H1 bond of the deformed
CH 4 molecule adsorbed on
the IrO 2 (110) surface (see
Fig. 8). This molecule is
isolated from the surface and
placed at the center of a large
periodic box in this
calculation. The energy step
size was set to 0.1 eV, the
Gaussian smoothing was
used with a standard
deviation value of 0.2 eV,
and a k-point sampling of 1
× 1 × 1 was used. The
Fermi level (E F ) is set to
zero (horizontal dashed line)
119
the green-line positive and negative peaks coming, respectively, from the 1t 2x and
2t
∗
2x orbitals. One should notice that the energy level of the 2a
∗
1 orbital and that of
the degenerate 2t
∗
2 set are often switched depending on the methodology used [67].
3.3.3 Effects of Methane’s Deformation on the COOP Curve
Next, we turn to the interaction between the orbitals of methane illustrated in Fig. 12c
and the surface orbitals of IrO 2 . However, as indicated in Fig. 8, we cannot pass by
the effects of deformation of methane. In order to look into the COOP curve for the
C–H bond of the deformed methane, we take out the deformed methane structure
from the CH 4 /IrO 2 (110) complex and place it into a large periodic box as those
shown in Fig. 10. Thus-calculated COOP curve is shown in Fig. 13. Comparing this
Fig. 13 COOP curve for the
C–H1 bond of the deformed
CH 4 molecule adsorbed on
the IrO 2 (110) surface (see
Fig. 8). This molecule is
isolated from the surface and
placed at the center of a large
periodic box in this
calculation. The energy step
size was set to 0.1 eV, the
Gaussian smoothing was
used with a standard
deviation value of 0.2 eV,
and a k-point sampling of 1
× 1 × 1 was used. The
Fermi level (E F ) is set to
zero (horizontal dashed line)