

118
Y. Tsuji et al.
of COOP is proportional to the product of the orbital coefficients, so we see a large
anti-bonding peak but a small bonding peak. This orbital feature is a general one
(see for example Ref. [65]); of course, this works in the case of CH 4 [66]. In the
subsequent COOP curves, one will be able to perceive such a feature.
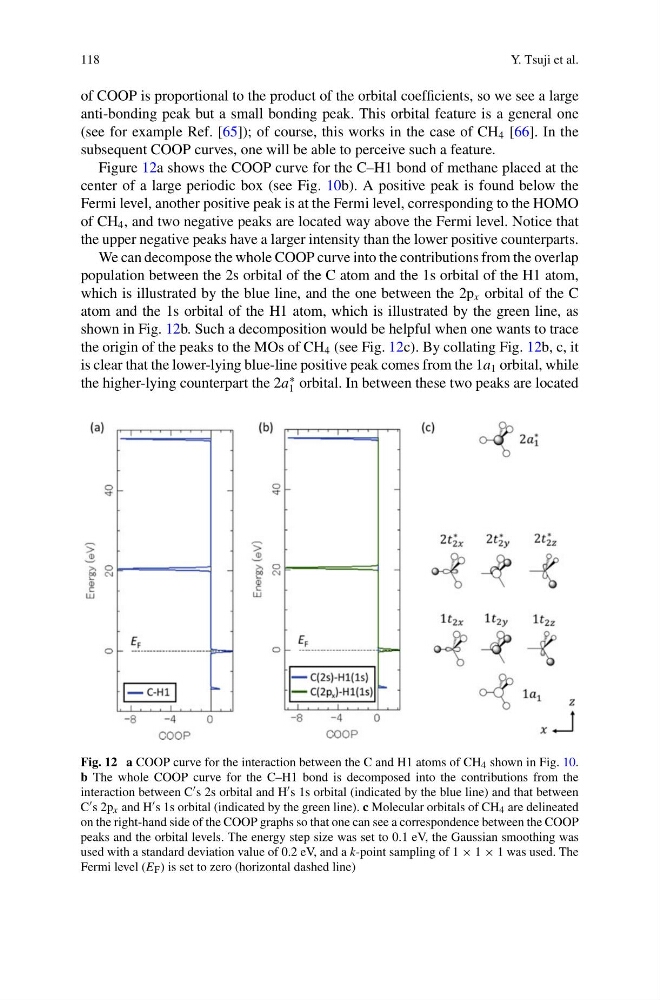
Figure 12a shows the COOP curve for the C–H1 bond of methane placed at the
center of a large periodic box (see Fig. 10b). A positive peak is found below the
Fermi level, another positive peak is at the Fermi level, corresponding to the HOMO
of CH 4 , and two negative peaks are located way above the Fermi level. Notice that
the upper negative peaks have a larger intensity than the lower positive counterparts.
We can decompose the whole COOP curve into the contributions from the overlap
population between the 2s orbital of the C atom and the 1s orbital of the H1 atom,
which is illustrated by the blue line, and the one between the 2p x orbital of the C
atom and the 1s orbital of the H1 atom, which is illustrated by the green line, as
shown in Fig. 12b. Such a decomposition would be helpful when one wants to trace
the origin of the peaks to the MOs of CH 4 (see Fig. 12c). By collating Fig. 12b, c, it
is clear that the lower-lying blue-line positive peak comes from the 1a 1 orbital, while
the higher-lying counterpart the 2a
∗
1 orbital. In between these two peaks are located
Fig. 12 a COOP curve for the interaction between the C and H1 atoms of CH 4 shown in Fig. 10.
b The whole COOP curve for the C–H1 bond is decomposed into the contributions from the
interaction between C s 2s orbital and H s 1s orbital (indicated by the blue line) and that between
C s 2p x and H s 1s orbital (indicated by the green line). c Molecular orbitals of CH 4 are delineated
on the right-hand side of the COOP graphs so that one can see a correspondence between the COOP
peaks and the orbital levels. The energy step size was set to 0.1 eV, the Gaussian smoothing was
used with a standard deviation value of 0.2 eV, and a k-point sampling of 1 × 1 × 1 was used. The
Fermi level (E F ) is set to zero (horizontal dashed line)
Y. Tsuji et al.
of COOP is proportional to the product of the orbital coefficients, so we see a large
anti-bonding peak but a small bonding peak. This orbital feature is a general one
(see for example Ref. [65]); of course, this works in the case of CH 4 [66]. In the
subsequent COOP curves, one will be able to perceive such a feature.
Figure 12a shows the COOP curve for the C–H1 bond of methane placed at the
center of a large periodic box (see Fig. 10b). A positive peak is found below the
Fermi level, another positive peak is at the Fermi level, corresponding to the HOMO
of CH 4 , and two negative peaks are located way above the Fermi level. Notice that
the upper negative peaks have a larger intensity than the lower positive counterparts.
We can decompose the whole COOP curve into the contributions from the overlap
population between the 2s orbital of the C atom and the 1s orbital of the H1 atom,
which is illustrated by the blue line, and the one between the 2p x orbital of the C
atom and the 1s orbital of the H1 atom, which is illustrated by the green line, as
shown in Fig. 12b. Such a decomposition would be helpful when one wants to trace
the origin of the peaks to the MOs of CH 4 (see Fig. 12c). By collating Fig. 12b, c, it
is clear that the lower-lying blue-line positive peak comes from the 1a 1 orbital, while
the higher-lying counterpart the 2a
∗
1 orbital. In between these two peaks are located
Fig. 12 a COOP curve for the interaction between the C and H1 atoms of CH 4 shown in Fig. 10.
b The whole COOP curve for the C–H1 bond is decomposed into the contributions from the
interaction between C s 2s orbital and H s 1s orbital (indicated by the blue line) and that between
C s 2p x and H s 1s orbital (indicated by the green line). c Molecular orbitals of CH 4 are delineated
on the right-hand side of the COOP graphs so that one can see a correspondence between the COOP
peaks and the orbital levels. The energy step size was set to 0.1 eV, the Gaussian smoothing was
used with a standard deviation value of 0.2 eV, and a k-point sampling of 1 × 1 × 1 was used. The
Fermi level (E F ) is set to zero (horizontal dashed line)