

Dynamics and Energetics of Methane …
105
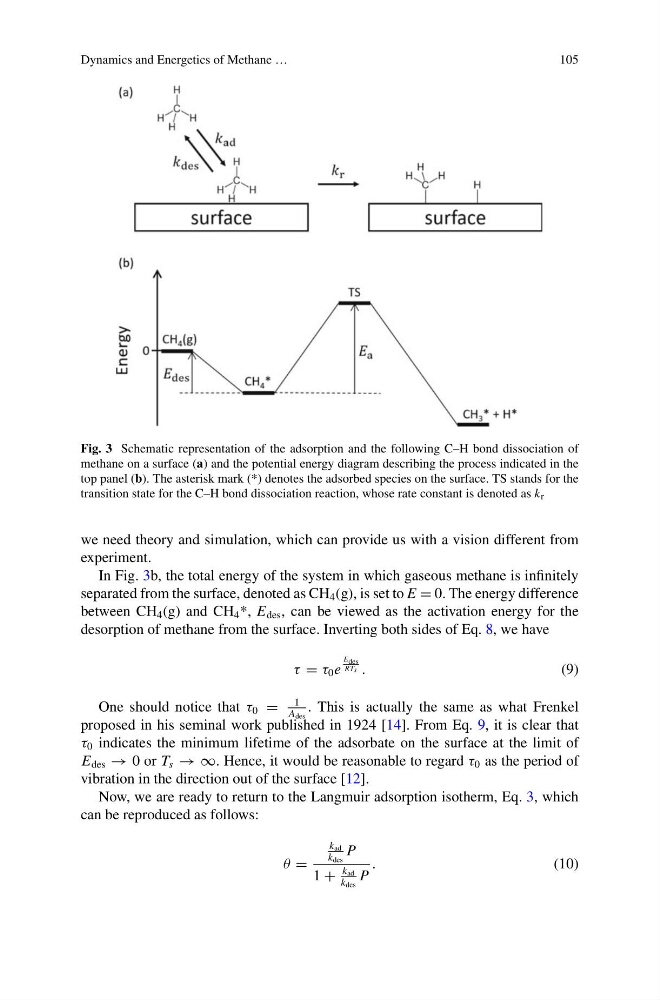
Fig. 3 Schematic representation of the adsorption and the following C–H bond dissociation of
methane on a surface (a) and the potential energy diagram describing the process indicated in the
top panel (b). The asterisk mark (*) denotes the adsorbed species on the surface. TS stands for the
transition state for the C–H bond dissociation reaction, whose rate constant is denoted as k r
we need theory and simulation, which can provide us with a vision different from
experiment.
In Fig. 3b, the total energy of the system in which gaseous methane is infinitely
separated from the surface, denoted as CH 4 (g), is set to E = 0. The energy difference
between CH 4 (g) and CH 4 *, E des , can be viewed as the activation energy for the
desorption of methane from the surface. Inverting both sides of Eq. 8, we have
τ = τ 0 e
E des
RTs .
(9)
One should notice that τ 0 =
1
A des
. This is actually the same as what Frenkel
proposed in his seminal work published in 1924 [14]. From Eq. 9, it is clear that
τ 0 indicates the minimum lifetime of the adsorbate on the surface at the limit of
E des → 0 or T s → ∞. Hence, it would be reasonable to regard τ 0 as the period of
vibration in the direction out of the surface [12].
Now, we are ready to return to the Langmuir adsorption isotherm, Eq. 3, which
can be reproduced as follows:
θ =
k ad
k des
P
1 +
k ad
k des
P
.
(10)
105
Fig. 3 Schematic representation of the adsorption and the following C–H bond dissociation of
methane on a surface (a) and the potential energy diagram describing the process indicated in the
top panel (b). The asterisk mark (*) denotes the adsorbed species on the surface. TS stands for the
transition state for the C–H bond dissociation reaction, whose rate constant is denoted as k r
we need theory and simulation, which can provide us with a vision different from
experiment.
In Fig. 3b, the total energy of the system in which gaseous methane is infinitely
separated from the surface, denoted as CH 4 (g), is set to E = 0. The energy difference
between CH 4 (g) and CH 4 *, E des , can be viewed as the activation energy for the
desorption of methane from the surface. Inverting both sides of Eq. 8, we have
τ = τ 0 e
E des
RTs .
(9)
One should notice that τ 0 =
1
A des
. This is actually the same as what Frenkel
proposed in his seminal work published in 1924 [14]. From Eq. 9, it is clear that
τ 0 indicates the minimum lifetime of the adsorbate on the surface at the limit of
E des → 0 or T s → ∞. Hence, it would be reasonable to regard τ 0 as the period of
vibration in the direction out of the surface [12].
Now, we are ready to return to the Langmuir adsorption isotherm, Eq. 3, which
can be reproduced as follows:
θ =
k ad
k des
P
1 +
k ad
k des
P
.
(10)