

52
3 Probing Methods: STM/S, PES, APECS, XAS, ZPS
Actually, Eq. (2) proves that the α
is exactly twice of the E BM resulting from
the relaxation of the chemical bond by the irregular-coordination effect:
α
= |E B L | + |E K M | = −(E K L + E K M ) = 2E B M ,
(4)
Therefore, one can measure the energy shift of the upper M level (or the valence
band) in the form of [16]:
E B M = −(E K L + E K M )/2
The slope β of the Wagner plot correlates the shift of the Auger kinetic energy
E KM and the photoelectron kinetic energy E KL (or the E BL in magnitude) [18,
19]. Subscript x represents the concentration of the element in the compound.
3.4.2 APECS: Dual-Level Shifts
With two independent measurements of the Auger parameters, for example, α
1 =
E B (1s) + E K (KLL) and α
2 = E B (2p) + E K (KLL), of compounds containing the
same constituent with different x concentrations, one could estimate the separation
between two levels, E B (1s) − E B (2p), rather than either of them alone [16, 20, 21].
3.4.3 Extended Wagner Plots: Screening and Recharging
Although the absolute energy shift varies from level to level, the relative shift of
each level across from their reference should be identical if no chemical process is
involved. One may extend the Wagner plot to the atomic CN (particle size) domain
to correlate the relative shifts of the APECS involved levels. This extension discriminates the effect of crystal-field screening from that of the valence recharging
(initial-final state and charge transport in reaction), in the following manner:
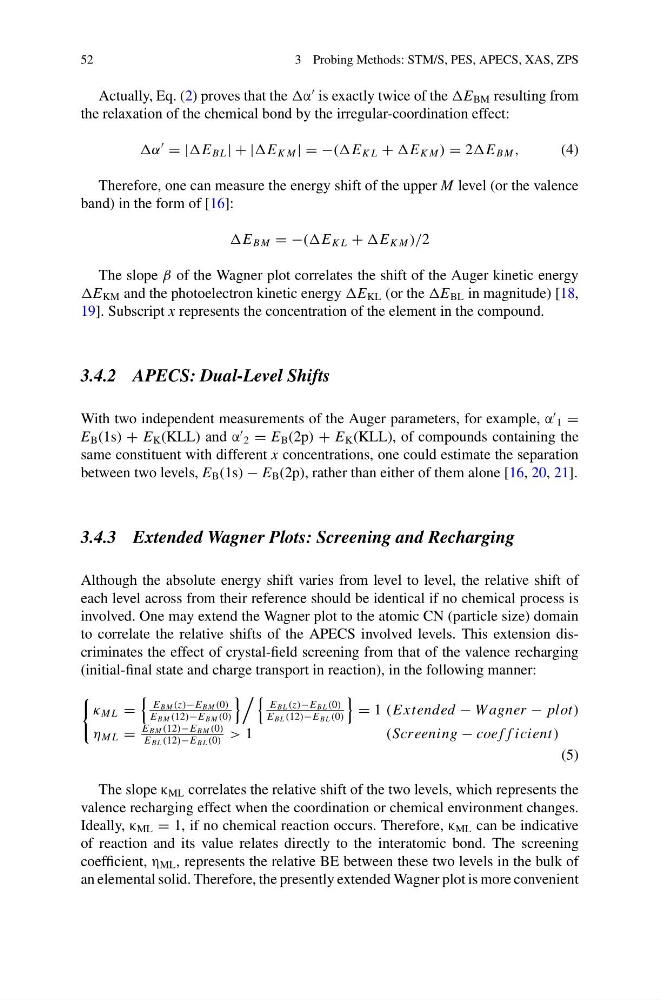
κ M L =
E B M (z)−EBM (0)
E B M (12)−EBM (0)
E BL (z)−EBL (0)
E BL (12)−EBL (0)
= 1 (E xtended − W agner − plot)
η M L =
E B M (12)−EBM (0)
E BL (12)−EBL (0)
> 1
(Screening − coe f f icient)
(5)
The slope κ ML correlates the relative shift of the two levels, which represents the
valence recharging effect when the coordination or chemical environment changes.
Ideally, κ ML = 1, if no chemical reaction occurs. Therefore, κ ML can be indicative
of reaction and its value relates directly to the interatomic bond. The screening
coefficient, η ML , represents the relative BE between these two levels in the bulk of
an elemental solid. Therefore, the presently extended Wagner plot is more convenient
3 Probing Methods: STM/S, PES, APECS, XAS, ZPS
Actually, Eq. (2) proves that the α
is exactly twice of the E BM resulting from
the relaxation of the chemical bond by the irregular-coordination effect:
α
= |E B L | + |E K M | = −(E K L + E K M ) = 2E B M ,
(4)
Therefore, one can measure the energy shift of the upper M level (or the valence
band) in the form of [16]:
E B M = −(E K L + E K M )/2
The slope β of the Wagner plot correlates the shift of the Auger kinetic energy
E KM and the photoelectron kinetic energy E KL (or the E BL in magnitude) [18,
19]. Subscript x represents the concentration of the element in the compound.
3.4.2 APECS: Dual-Level Shifts
With two independent measurements of the Auger parameters, for example, α
1 =
E B (1s) + E K (KLL) and α
2 = E B (2p) + E K (KLL), of compounds containing the
same constituent with different x concentrations, one could estimate the separation
between two levels, E B (1s) − E B (2p), rather than either of them alone [16, 20, 21].
3.4.3 Extended Wagner Plots: Screening and Recharging
Although the absolute energy shift varies from level to level, the relative shift of
each level across from their reference should be identical if no chemical process is
involved. One may extend the Wagner plot to the atomic CN (particle size) domain
to correlate the relative shifts of the APECS involved levels. This extension discriminates the effect of crystal-field screening from that of the valence recharging
(initial-final state and charge transport in reaction), in the following manner:
κ M L =
E B M (z)−EBM (0)
E B M (12)−EBM (0)
E BL (z)−EBL (0)
E BL (12)−EBL (0)
= 1 (E xtended − W agner − plot)
η M L =
E B M (12)−EBM (0)
E BL (12)−EBL (0)
> 1
(Screening − coe f f icient)
(5)
The slope κ ML correlates the relative shift of the two levels, which represents the
valence recharging effect when the coordination or chemical environment changes.
Ideally, κ ML = 1, if no chemical reaction occurs. Therefore, κ ML can be indicative
of reaction and its value relates directly to the interatomic bond. The screening
coefficient, η ML , represents the relative BE between these two levels in the bulk of
an elemental solid. Therefore, the presently extended Wagner plot is more convenient