

23.3 Bulk Crystals: Compression and Thermal Excitation
461
0.960
0.968
0.976
0.984
0.992
1.000
0
200
400
600
800
3.00
3.06
3.12
3.18
3.24
3.30
3.36
E
G
(T)
T (K)
Theory
Data-1
Data-2
Data-3
Data-4
T (K)
Y(T) / Y(T
0
)
Theory
Experiment
(a)
(c)
(d)
(b)
0.80
0.85
0.90
0.95
1.00
Δω (T)/Δω (T
0
)
T (K)
Theory
E 1 (LO)
A 1 (LO)
E 2 (high)
E 2 (high)
1.00
1.05
1.10
Y(P) / Y(0)
P (GPa)
BOLS
Measurement
0
200
400
600
800
0
200
400
600
800
0
2
4
6
8
1 0
0
2
4
6
8
300
400
500
600
Δω (cm
-1
)
P (GPa)
P-BOLS
E 1 (LO)
E 2 (high)
E 1 (TO)
A 1 (TO)
B 1 (LO)
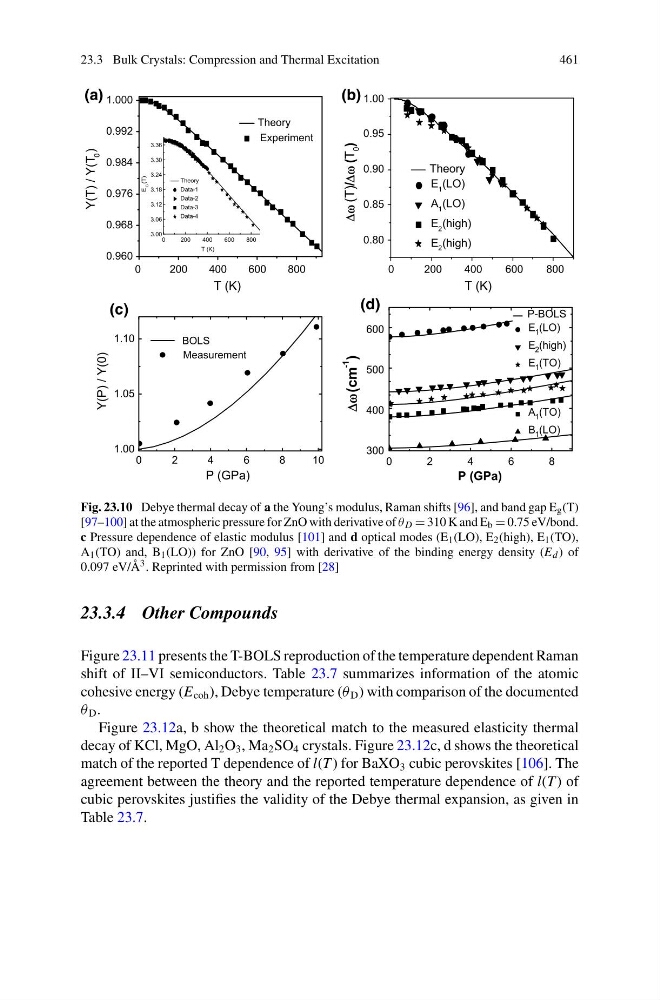
Fig. 23.10 Debye thermal decay of a the Young’s modulus, Raman shifts [96], and band gap E g (T)
[97–100] at the atmospheric pressure for ZnO with derivative of θ D = 310 K and E b = 0.75 eV/bond.
c Pressure dependence of elastic modulus [101] and d optical modes (E 1 (LO), E 2 (high), E 1 (TO),
A 1 (TO) and, B 1 (LO)) for ZnO [90, 95] with derivative of the binding energy density (E d ) of
0.097 eV/Å 3 . Reprinted with permission from [28]
23.3.4 Other Compounds
Figure 23.11 presents the T-BOLS reproduction of the temperature dependent Raman
shift of II–VI semiconductors. Table 23.7 summarizes information of the atomic
cohesive energy (E coh ), Debye temperature (θ D ) with comparison of the documented
θ D .
Figure 23.12a, b show the theoretical match to the measured elasticity thermal
decay of KCl, MgO, Al 2 O 3 , Ma 2 SO 4 crystals. Figure 23.12c, d shows the theoretical
match of the reported T dependence of l(T ) for BaXO 3 cubic perovskites [106]. The
agreement between the theory and the reported temperature dependence of l(T ) of
cubic perovskites justifies the validity of the Debye thermal expansion, as given in
Table 23.7.
461
0.960
0.968
0.976
0.984
0.992
1.000
0
200
400
600
800
3.00
3.06
3.12
3.18
3.24
3.30
3.36
E
G
(T)
T (K)
Theory
Data-1
Data-2
Data-3
Data-4
T (K)
Y(T) / Y(T
0
)
Theory
Experiment
(a)
(c)
(d)
(b)
0.80
0.85
0.90
0.95
1.00
Δω (T)/Δω (T
0
)
T (K)
Theory
E 1 (LO)
A 1 (LO)
E 2 (high)
E 2 (high)
1.00
1.05
1.10
Y(P) / Y(0)
P (GPa)
BOLS
Measurement
0
200
400
600
800
0
200
400
600
800
0
2
4
6
8
1 0
0
2
4
6
8
300
400
500
600
Δω (cm
-1
)
P (GPa)
P-BOLS
E 1 (LO)
E 2 (high)
E 1 (TO)
A 1 (TO)
B 1 (LO)
Fig. 23.10 Debye thermal decay of a the Young’s modulus, Raman shifts [96], and band gap E g (T)
[97–100] at the atmospheric pressure for ZnO with derivative of θ D = 310 K and E b = 0.75 eV/bond.
c Pressure dependence of elastic modulus [101] and d optical modes (E 1 (LO), E 2 (high), E 1 (TO),
A 1 (TO) and, B 1 (LO)) for ZnO [90, 95] with derivative of the binding energy density (E d ) of
0.097 eV/Å 3 . Reprinted with permission from [28]
23.3.4 Other Compounds
Figure 23.11 presents the T-BOLS reproduction of the temperature dependent Raman
shift of II–VI semiconductors. Table 23.7 summarizes information of the atomic
cohesive energy (E coh ), Debye temperature (θ D ) with comparison of the documented
θ D .
Figure 23.12a, b show the theoretical match to the measured elasticity thermal
decay of KCl, MgO, Al 2 O 3 , Ma 2 SO 4 crystals. Figure 23.12c, d shows the theoretical
match of the reported T dependence of l(T ) for BaXO 3 cubic perovskites [106]. The
agreement between the theory and the reported temperature dependence of l(T ) of
cubic perovskites justifies the validity of the Debye thermal expansion, as given in
Table 23.7.