

460
23 Sized Crystals
0.6
0.7
0.8
0.9
1.0
T(K)
B(T) / B(0)
Δω(T) / Δω(0)
(a)
0
500
1000
1500
2000
0
2
4
6
8
10
12
1.0
1.1
1.2
1.3
(b)
P(GPa)
B(P) / B(0)
Δω(P) / Δω(0)
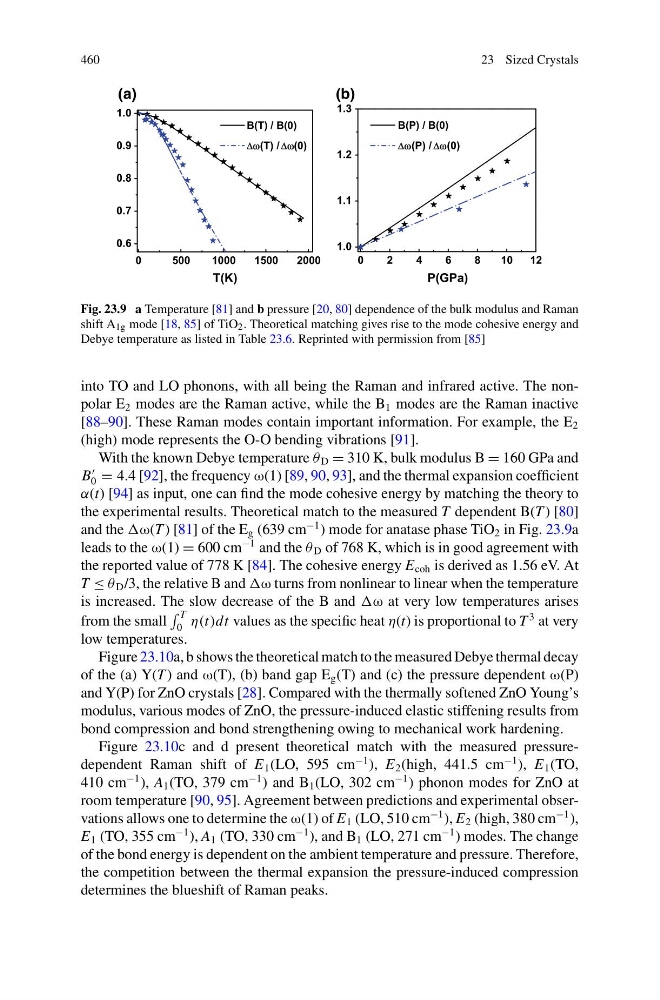
Fig. 23.9 a Temperature [81] and b pressure [20, 80] dependence of the bulk modulus and Raman
shift A 1g mode [18, 85] of TiO 2 . Theoretical matching gives rise to the mode cohesive energy and
Debye temperature as listed in Table 23.6. Reprinted with permission from [85]
into TO and LO phonons, with all being the Raman and infrared active. The nonpolar E 2 modes are the Raman active, while the B 1 modes are the Raman inactive
[88–90]. These Raman modes contain important information. For example, the E 2
(high) mode represents the O-O bending vibrations [91].
With the known Debye temperature θ D = 310 K, bulk modulus B = 160 GPa and
B
0 = 4.4 [92], the frequency ω(1) [89, 90, 93], and the thermal expansion coefficient
α(t) [94] as input, one can find the mode cohesive energy by matching the theory to
the experimental results. Theoretical match to the measured T dependent B(T ) [80]
and the ) [81] of the E g (639 cm
−1 ) mode for anatase phase TiO 2 in Fig. 23.9a
leads to the ω(1) = 600 cm
−1 and the θ D of 768 K, which is in good agreement with
the reported value of 778 K [84]. The cohesive energy E coh is derived as 1.56 eV. At
T ≤ θ D /3, the relative B and turns from nonlinear to linear when the temperature
is increased. The slow decrease of the B and at very low temperatures arises
from the small
T
0 η(t)dt values as the specific heat η(t) is proportional to T
3 at very
low temperatures.
Figure 23.10a, b shows the theoretical match to the measured Debye thermal decay
of the (a) Y(T ) and ω(T), (b) band gap E g (T) and (c) the pressure dependent ω(P)
and Y(P) for ZnO crystals [28]. Compared with the thermally softened ZnO Young’s
modulus, various modes of ZnO, the pressure-induced elastic stiffening results from
bond compression and bond strengthening owing to mechanical work hardening.
Figure 23.10c and d present theoretical match with the measured pressuredependent Raman shift of E 1 (LO, 595 cm
−1 ), E 2 (high, 441.5 cm
−1 ), E 1 (TO,
410 cm
−1 ), A 1 (TO, 379 cm
−1 ) and B 1 (LO, 302 cm
−1 ) phonon modes for ZnO at
room temperature [90, 95]. Agreement between predictions and experimental observations allows one to determine the ω(1) of E 1 (LO, 510 cm
−1 ), E 2 (high, 380 cm
−1 ),
E 1 (TO, 355 cm
−1 ), A 1 (TO, 330 cm
−1 ), and B 1 (LO, 271 cm
−1 ) modes. The change
of the bond energy is dependent on the ambient temperature and pressure. Therefore,
the competition between the thermal expansion the pressure-induced compression
determines the blueshift of Raman peaks.
23 Sized Crystals
0.6
0.7
0.8
0.9
1.0
T(K)
B(T) / B(0)
Δω(T) / Δω(0)
(a)
0
500
1000
1500
2000
0
2
4
6
8
10
12
1.0
1.1
1.2
1.3
(b)
P(GPa)
B(P) / B(0)
Δω(P) / Δω(0)
Fig. 23.9 a Temperature [81] and b pressure [20, 80] dependence of the bulk modulus and Raman
shift A 1g mode [18, 85] of TiO 2 . Theoretical matching gives rise to the mode cohesive energy and
Debye temperature as listed in Table 23.6. Reprinted with permission from [85]
into TO and LO phonons, with all being the Raman and infrared active. The nonpolar E 2 modes are the Raman active, while the B 1 modes are the Raman inactive
[88–90]. These Raman modes contain important information. For example, the E 2
(high) mode represents the O-O bending vibrations [91].
With the known Debye temperature θ D = 310 K, bulk modulus B = 160 GPa and
B
0 = 4.4 [92], the frequency ω(1) [89, 90, 93], and the thermal expansion coefficient
α(t) [94] as input, one can find the mode cohesive energy by matching the theory to
the experimental results. Theoretical match to the measured T dependent B(T ) [80]
and the ) [81] of the E g (639 cm
−1 ) mode for anatase phase TiO 2 in Fig. 23.9a
leads to the ω(1) = 600 cm
−1 and the θ D of 768 K, which is in good agreement with
the reported value of 778 K [84]. The cohesive energy E coh is derived as 1.56 eV. At
T ≤ θ D /3, the relative B and turns from nonlinear to linear when the temperature
is increased. The slow decrease of the B and at very low temperatures arises
from the small
T
0 η(t)dt values as the specific heat η(t) is proportional to T
3 at very
low temperatures.
Figure 23.10a, b shows the theoretical match to the measured Debye thermal decay
of the (a) Y(T ) and ω(T), (b) band gap E g (T) and (c) the pressure dependent ω(P)
and Y(P) for ZnO crystals [28]. Compared with the thermally softened ZnO Young’s
modulus, various modes of ZnO, the pressure-induced elastic stiffening results from
bond compression and bond strengthening owing to mechanical work hardening.
Figure 23.10c and d present theoretical match with the measured pressuredependent Raman shift of E 1 (LO, 595 cm
−1 ), E 2 (high, 441.5 cm
−1 ), E 1 (TO,
410 cm
−1 ), A 1 (TO, 379 cm
−1 ) and B 1 (LO, 302 cm
−1 ) phonon modes for ZnO at
room temperature [90, 95]. Agreement between predictions and experimental observations allows one to determine the ω(1) of E 1 (LO, 510 cm
−1 ), E 2 (high, 380 cm
−1 ),
E 1 (TO, 355 cm
−1 ), A 1 (TO, 330 cm
−1 ), and B 1 (LO, 271 cm
−1 ) modes. The change
of the bond energy is dependent on the ambient temperature and pressure. Therefore,
the competition between the thermal expansion the pressure-induced compression
determines the blueshift of Raman peaks.