

458
23 Sized Crystals
630
640
650
660
855
870
885
900
(a)
(b)
(c)
E 2 (high)
A 1 (LO)
AlN
Δω (cm
-1
)
T (K)
T (K)
560
564
568
726
732
738
744
E 2 (high)
A 1 (LO)
GaN
485
490
495
585
590
595
600
E 2 (high)
A 1 (LO)
InN
T (K)
600
630
660
690
900
930
960
Δω (cm
-1
)
A 1 (TO)
E 2 (high)
A 1 (LO)
AlN
570
585
600
615
740
760
780
P (GPa)
P (GPa)
E 2 (high)
A 1 (LO)
GaN
P (GPa)
0
500 1000
0 250 500 750
0 150 300 450
0 2 4 6 8 10
0 2 4 6 8 10
0 2 4 6 8 10
475
500
525
600
625
650
A 1 (LO)
E 2 (high)
InN
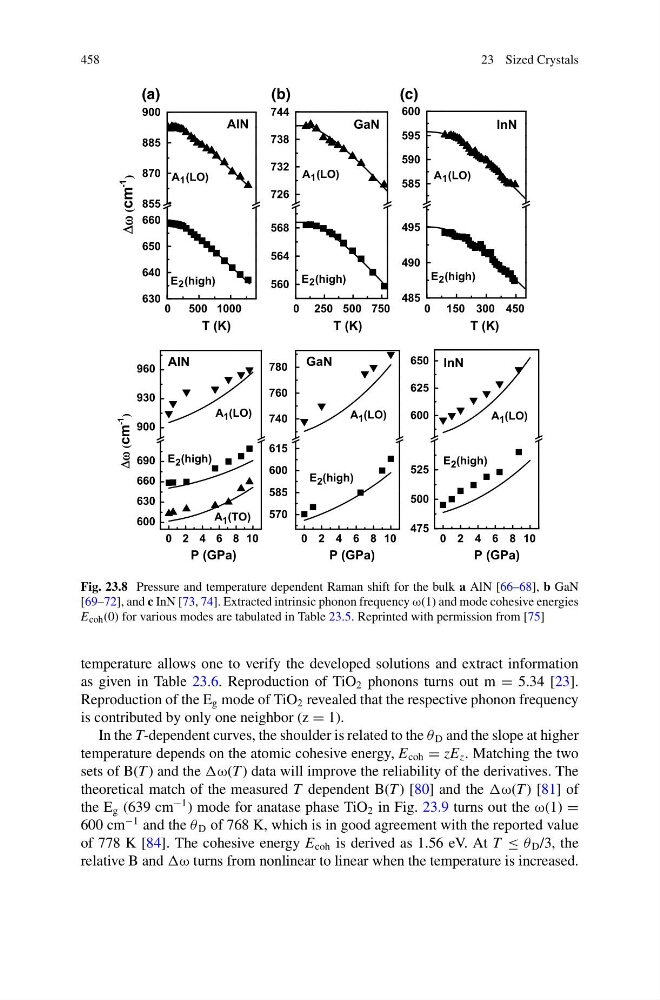
Fig. 23.8 Pressure and temperature dependent Raman shift for the bulk a AlN [66–68], b GaN
[69–72], and c InN [73, 74]. Extracted intrinsic phonon frequency ω(1) and mode cohesive energies
E coh (0) for various modes are tabulated in Table 23.5. Reprinted with permission from [75]
temperature allows one to verify the developed solutions and extract information
as given in Table 23.6. Reproduction of TiO 2 phonons turns out m = 5.34 [23].
Reproduction of the E g mode of TiO 2 revealed that the respective phonon frequency
is contributed by only one neighbor (z = 1).
In the T-dependent curves, the shoulder is related to the θ D and the slope at higher
temperature depends on the atomic cohesive energy, E coh = zE z . Matching the two
sets of B(T ) and the ) data will improve the reliability of the derivatives. The
theoretical match of the measured T dependent B(T ) [80] and the ) [81] of
the E g (639 cm
−1 ) mode for anatase phase TiO 2 in Fig. 23.9 turns out the ω(1) =
600 cm
−1 and the θ D of 768 K, which is in good agreement with the reported value
of 778 K [84]. The cohesive energy E coh is derived as 1.56 eV. At T ≤ θ D /3, the
relative B and turns from nonlinear to linear when the temperature is increased.
23 Sized Crystals
630
640
650
660
855
870
885
900
(a)
(b)
(c)
E 2 (high)
A 1 (LO)
AlN
Δω (cm
-1
)
T (K)
T (K)
560
564
568
726
732
738
744
E 2 (high)
A 1 (LO)
GaN
485
490
495
585
590
595
600
E 2 (high)
A 1 (LO)
InN
T (K)
600
630
660
690
900
930
960
Δω (cm
-1
)
A 1 (TO)
E 2 (high)
A 1 (LO)
AlN
570
585
600
615
740
760
780
P (GPa)
P (GPa)
E 2 (high)
A 1 (LO)
GaN
P (GPa)
0
500 1000
0 250 500 750
0 150 300 450
0 2 4 6 8 10
0 2 4 6 8 10
0 2 4 6 8 10
475
500
525
600
625
650
A 1 (LO)
E 2 (high)
InN
Fig. 23.8 Pressure and temperature dependent Raman shift for the bulk a AlN [66–68], b GaN
[69–72], and c InN [73, 74]. Extracted intrinsic phonon frequency ω(1) and mode cohesive energies
E coh (0) for various modes are tabulated in Table 23.5. Reprinted with permission from [75]
temperature allows one to verify the developed solutions and extract information
as given in Table 23.6. Reproduction of TiO 2 phonons turns out m = 5.34 [23].
Reproduction of the E g mode of TiO 2 revealed that the respective phonon frequency
is contributed by only one neighbor (z = 1).
In the T-dependent curves, the shoulder is related to the θ D and the slope at higher
temperature depends on the atomic cohesive energy, E coh = zE z . Matching the two
sets of B(T ) and the ) data will improve the reliability of the derivatives. The
theoretical match of the measured T dependent B(T ) [80] and the ) [81] of
the E g (639 cm
−1 ) mode for anatase phase TiO 2 in Fig. 23.9 turns out the ω(1) =
600 cm
−1 and the θ D of 768 K, which is in good agreement with the reported value
of 778 K [84]. The cohesive energy E coh is derived as 1.56 eV. At T ≤ θ D /3, the
relative B and turns from nonlinear to linear when the temperature is increased.