

23.3 Bulk Crystals: Compression and Thermal Excitation
457
0.95
0.96
0.97
0.98
0.99
1.00
(a)
(b)
(c)
T/T m
T/T m
T/T m
Δω(T)/Δω 0
Y(T)/Y 0
Diamond
0.95
0.96
0.97
0.98
0.99
1.00
Δω(T)/Δω 0
Y(T)/Y 0
Si
0.0 0.1 0.2 0.3
0.0
0.4
0.8
0.0
0.4
0.8
0.95
0.96
0.97
0.98
0.99
1.00
Δω(T)/Δω 0
Y(T)/Y 0
Ge
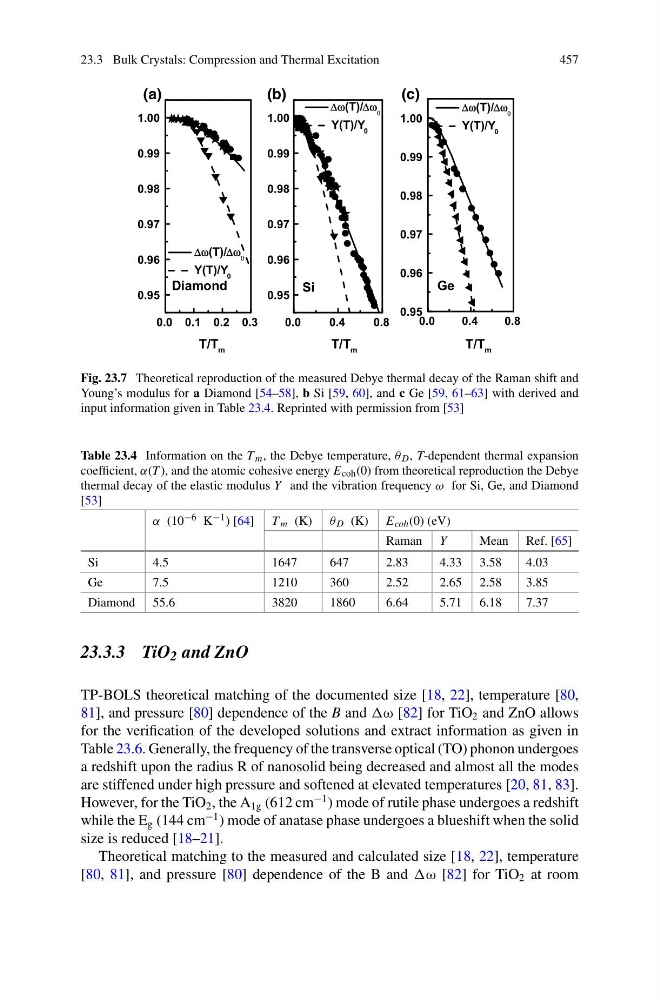
Fig. 23.7 Theoretical reproduction of the measured Debye thermal decay of the Raman shift and
Young’s modulus for a Diamond [54–58], b Si [59, 60], and c Ge [59, 61–63] with derived and
input information given in Table 23.4. Reprinted with permission from [53]
Table 23.4 Information on the T m , the Debye temperature, θ D , T-dependent thermal expansion
coefficient, α(T ), and the atomic cohesive energy E coh (0) from theoretical reproduction the Debye
thermal decay of the elastic modulus Y and the vibration frequency ω for Si, Ge, and Diamond
[53]
α (10 −6 K −1 ) [64] T m (K) θ D (K) E coh (0) (eV)
Raman Y
Mean Ref. [65]
Si
4.5
1647
647
2.83
4.33 3.58
4.03
Ge
7.5
1210
360
2.52
2.65 2.58
3.85
Diamond 55.6
3820
1860
6.64
5.71 6.18
7.37
23.3.3 TiO 2 and ZnO
TP-BOLS theoretical matching of the documented size [18, 22], temperature [80,
81], and pressure [80] dependence of the B and [82] for TiO 2 and ZnO allows
for the verification of the developed solutions and extract information as given in
Table 23.6. Generally, the frequency of the transverse optical (TO) phonon undergoes
a redshift upon the radius R of nanosolid being decreased and almost all the modes
are stiffened under high pressure and softened at elevated temperatures [20, 81, 83].
However, for the TiO 2 , the A 1g (612 cm
−1 ) mode of rutile phase undergoes a redshift
while the E g (144 cm
−1 ) mode of anatase phase undergoes a blueshift when the solid
size is reduced [18–21].
Theoretical matching to the measured and calculated size [18, 22], temperature
[80, 81], and pressure [80] dependence of the B and [82] for TiO 2 at room
457
0.95
0.96
0.97
0.98
0.99
1.00
(a)
(b)
(c)
T/T m
T/T m
T/T m
Δω(T)/Δω 0
Y(T)/Y 0
Diamond
0.95
0.96
0.97
0.98
0.99
1.00
Δω(T)/Δω 0
Y(T)/Y 0
Si
0.0 0.1 0.2 0.3
0.0
0.4
0.8
0.0
0.4
0.8
0.95
0.96
0.97
0.98
0.99
1.00
Δω(T)/Δω 0
Y(T)/Y 0
Ge
Fig. 23.7 Theoretical reproduction of the measured Debye thermal decay of the Raman shift and
Young’s modulus for a Diamond [54–58], b Si [59, 60], and c Ge [59, 61–63] with derived and
input information given in Table 23.4. Reprinted with permission from [53]
Table 23.4 Information on the T m , the Debye temperature, θ D , T-dependent thermal expansion
coefficient, α(T ), and the atomic cohesive energy E coh (0) from theoretical reproduction the Debye
thermal decay of the elastic modulus Y and the vibration frequency ω for Si, Ge, and Diamond
[53]
α (10 −6 K −1 ) [64] T m (K) θ D (K) E coh (0) (eV)
Raman Y
Mean Ref. [65]
Si
4.5
1647
647
2.83
4.33 3.58
4.03
Ge
7.5
1210
360
2.52
2.65 2.58
3.85
Diamond 55.6
3820
1860
6.64
5.71 6.18
7.37
23.3.3 TiO 2 and ZnO
TP-BOLS theoretical matching of the documented size [18, 22], temperature [80,
81], and pressure [80] dependence of the B and [82] for TiO 2 and ZnO allows
for the verification of the developed solutions and extract information as given in
Table 23.6. Generally, the frequency of the transverse optical (TO) phonon undergoes
a redshift upon the radius R of nanosolid being decreased and almost all the modes
are stiffened under high pressure and softened at elevated temperatures [20, 81, 83].
However, for the TiO 2 , the A 1g (612 cm
−1 ) mode of rutile phase undergoes a redshift
while the E g (144 cm
−1 ) mode of anatase phase undergoes a blueshift when the solid
size is reduced [18–21].
Theoretical matching to the measured and calculated size [18, 22], temperature
[80, 81], and pressure [80] dependence of the B and [82] for TiO 2 at room