

452
23 Sized Crystals
0
1
2
3
4
(a)
(b)
(c)
ΔY/Y
K
TiO 2
0.0
0.1
0.2
0.3
0.4
0.5
TiO 2
A 1g
K
Δ(Δω)/Δω
E g
2
4
6
0 20 40 60 80
0 10 20 30
-0.5
-0.4
-0.3
-0.2
-0.1
0.0
TiO 2
Δ(Δω)/Δω
K
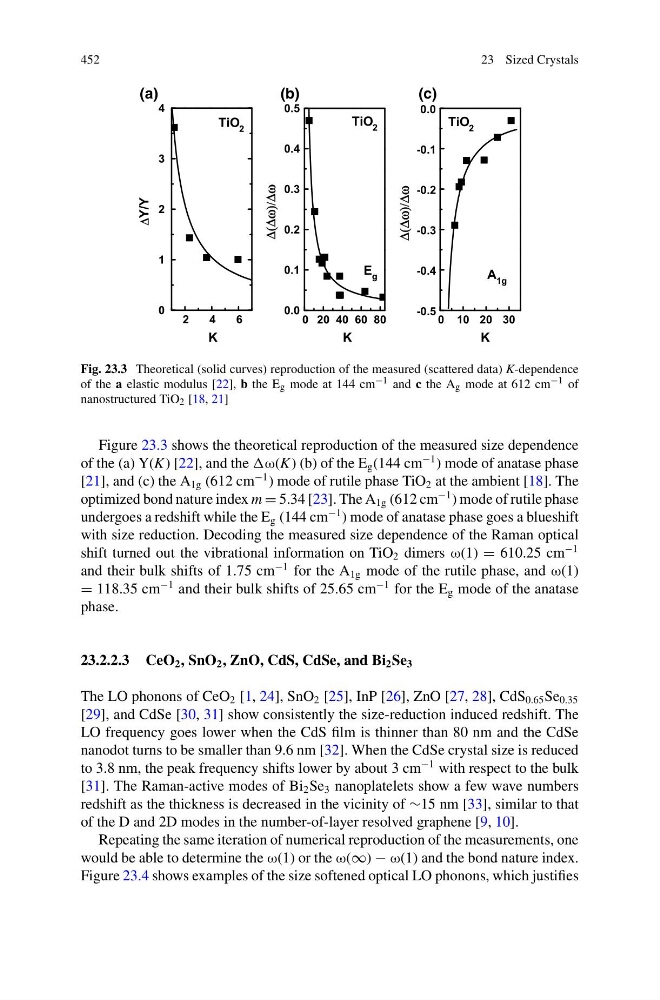
Fig. 23.3 Theoretical (solid curves) reproduction of the measured (scattered data) K-dependence
of the a elastic modulus [22], b the E g mode at 144 cm −1 and c the A g mode at 612 cm −1 of
nanostructured TiO 2 [18, 21]
Figure 23.3 shows the theoretical reproduction of the measured size dependence
of the (a) Y(K) [22], and the (b) of the E g (144 cm
−1 ) mode of anatase phase
[21], and (c) the A 1g (612 cm
−1 ) mode of rutile phase TiO 2 at the ambient [18]. The
optimized bond nature index m = 5.34 [23]. The A 1g (612 cm
−1 ) mode of rutile phase
undergoes a redshift while the E g (144 cm
−1 ) mode of anatase phase goes a blueshift
with size reduction. Decoding the measured size dependence of the Raman optical
shift turned out the vibrational information on TiO 2 dimers ω(1) = 610.25 cm
−1
and their bulk shifts of 1.75 cm
−1 for the A 1g mode of the rutile phase, and ω(1)
= 118.35 cm
−1 and their bulk shifts of 25.65 cm
−1 for the E g mode of the anatase
phase.
23.2.2.3 CeO 2 , SnO 2 , ZnO, CdS, CdSe, and Bi 2 Se 3
The LO phonons of CeO 2 [1, 24], SnO 2 [25], InP [26], ZnO [27, 28], CdS 0.65 Se 0.35
[29], and CdSe [30, 31] show consistently the size-reduction induced redshift. The
LO frequency goes lower when the CdS film is thinner than 80 nm and the CdSe
nanodot turns to be smaller than 9.6 nm [32]. When the CdSe crystal size is reduced
to 3.8 nm, the peak frequency shifts lower by about 3 cm
−1 with respect to the bulk
[31]. The Raman-active modes of Bi 2 Se 3 nanoplatelets show a few wave numbers
redshift as the thickness is decreased in the vicinity of ∼15 nm [33], similar to that
of the D and 2D modes in the number-of-layer resolved graphene [9, 10].
Repeating the same iteration of numerical reproduction of the measurements, one
would be able to determine the ω(1) or the ω(∞) − ω(1) and the bond nature index.
Figure 23.4 shows examples of the size softened optical LO phonons, which justifies
23 Sized Crystals
0
1
2
3
4
(a)
(b)
(c)
ΔY/Y
K
TiO 2
0.0
0.1
0.2
0.3
0.4
0.5
TiO 2
A 1g
K
Δ(Δω)/Δω
E g
2
4
6
0 20 40 60 80
0 10 20 30
-0.5
-0.4
-0.3
-0.2
-0.1
0.0
TiO 2
Δ(Δω)/Δω
K
Fig. 23.3 Theoretical (solid curves) reproduction of the measured (scattered data) K-dependence
of the a elastic modulus [22], b the E g mode at 144 cm −1 and c the A g mode at 612 cm −1 of
nanostructured TiO 2 [18, 21]
Figure 23.3 shows the theoretical reproduction of the measured size dependence
of the (a) Y(K) [22], and the (b) of the E g (144 cm
−1 ) mode of anatase phase
[21], and (c) the A 1g (612 cm
−1 ) mode of rutile phase TiO 2 at the ambient [18]. The
optimized bond nature index m = 5.34 [23]. The A 1g (612 cm
−1 ) mode of rutile phase
undergoes a redshift while the E g (144 cm
−1 ) mode of anatase phase goes a blueshift
with size reduction. Decoding the measured size dependence of the Raman optical
shift turned out the vibrational information on TiO 2 dimers ω(1) = 610.25 cm
−1
and their bulk shifts of 1.75 cm
−1 for the A 1g mode of the rutile phase, and ω(1)
= 118.35 cm
−1 and their bulk shifts of 25.65 cm
−1 for the E g mode of the anatase
phase.
23.2.2.3 CeO 2 , SnO 2 , ZnO, CdS, CdSe, and Bi 2 Se 3
The LO phonons of CeO 2 [1, 24], SnO 2 [25], InP [26], ZnO [27, 28], CdS 0.65 Se 0.35
[29], and CdSe [30, 31] show consistently the size-reduction induced redshift. The
LO frequency goes lower when the CdS film is thinner than 80 nm and the CdSe
nanodot turns to be smaller than 9.6 nm [32]. When the CdSe crystal size is reduced
to 3.8 nm, the peak frequency shifts lower by about 3 cm
−1 with respect to the bulk
[31]. The Raman-active modes of Bi 2 Se 3 nanoplatelets show a few wave numbers
redshift as the thickness is decreased in the vicinity of ∼15 nm [33], similar to that
of the D and 2D modes in the number-of-layer resolved graphene [9, 10].
Repeating the same iteration of numerical reproduction of the measurements, one
would be able to determine the ω(1) or the ω(∞) − ω(1) and the bond nature index.
Figure 23.4 shows examples of the size softened optical LO phonons, which justifies