

23.2 Nanocrystals: Size and Thermal Effects
451
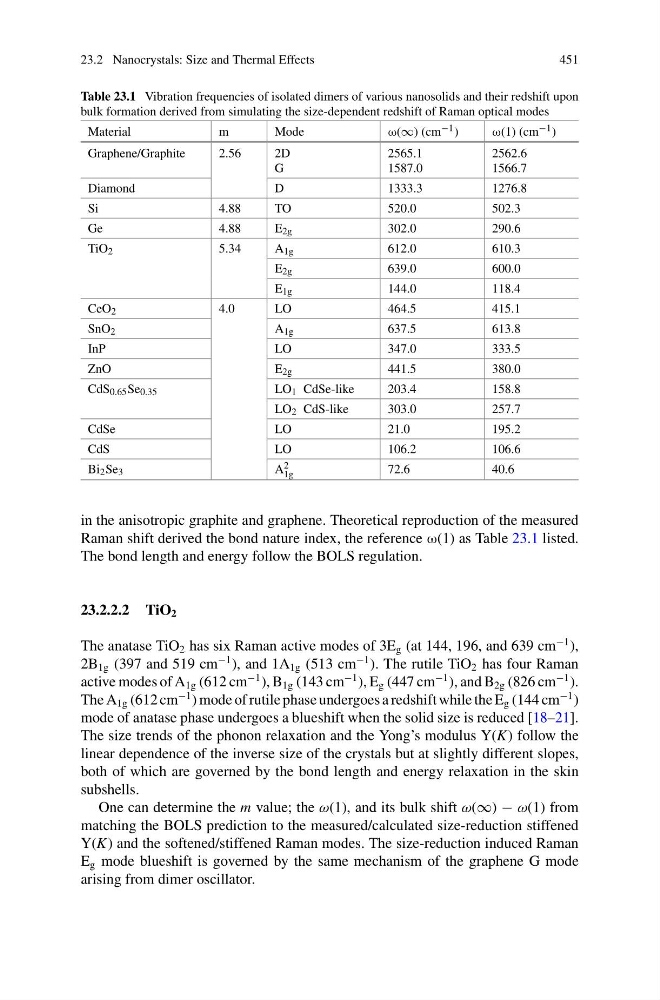
Table 23.1 Vibration frequencies of isolated dimers of various nanosolids and their redshift upon
bulk formation derived from simulating the size-dependent redshift of Raman optical modes
Material
m
Mode
ω(∞) (cm −1 )
ω(1) (cm −1 )
Graphene/Graphite
2.56
2D
G
2565.1
1587.0
2562.6
1566.7
Diamond
D
1333.3
1276.8
Si
4.88
TO
520.0
502.3
Ge
4.88
E 2g
302.0
290.6
TiO 2
5.34
A 1g
612.0
610.3
E 2g
639.0
600.0
E 1g
144.0
118.4
CeO 2
4.0
LO
464.5
415.1
SnO 2
A 1g
637.5
613.8
InP
LO
347.0
333.5
ZnO
E 2g
441.5
380.0
CdS 0.65 Se 0.35
LO 1 CdSe-like
203.4
158.8
LO 2 CdS-like
303.0
257.7
CdSe
LO
21.0
195.2
CdS
LO
106.2
106.6
Bi 2 Se 3
A 2
1g
72.6
40.6
in the anisotropic graphite and graphene. Theoretical reproduction of the measured
Raman shift derived the bond nature index, the reference ω(1) as Table 23.1 listed.
The bond length and energy follow the BOLS regulation.
23.2.2.2 TiO 2
The anatase TiO 2 has six Raman active modes of 3E g (at 144, 196, and 639 cm
−1 ),
2B 1g (397 and 519 cm
−1 ), and 1A 1g (513 cm
−1 ). The rutile TiO 2 has four Raman
active modes of A 1g (612 cm
−1 ), B 1g (143 cm
−1 ), E g (447 cm
−1 ), and B 2g (826 cm
−1 ).
The A 1g (612 cm
−1 ) mode of rutile phase undergoes a redshift while the E g (144 cm
−1 )
mode of anatase phase undergoes a blueshift when the solid size is reduced [18–21].
The size trends of the phonon relaxation and the Yong’s modulus Y(K) follow the
linear dependence of the inverse size of the crystals but at slightly different slopes,
both of which are governed by the bond length and energy relaxation in the skin
subshells.
One can determine the m value; the ω(1), and its bulk shift ω(∞) − ω(1) from
matching the BOLS prediction to the measured/calculated size-reduction stiffened
Y(K) and the softened/stiffened Raman modes. The size-reduction induced Raman
E g mode blueshift is governed by the same mechanism of the graphene G mode
arising from dimer oscillator.
451
Table 23.1 Vibration frequencies of isolated dimers of various nanosolids and their redshift upon
bulk formation derived from simulating the size-dependent redshift of Raman optical modes
Material
m
Mode
ω(∞) (cm −1 )
ω(1) (cm −1 )
Graphene/Graphite
2.56
2D
G
2565.1
1587.0
2562.6
1566.7
Diamond
D
1333.3
1276.8
Si
4.88
TO
520.0
502.3
Ge
4.88
E 2g
302.0
290.6
TiO 2
5.34
A 1g
612.0
610.3
E 2g
639.0
600.0
E 1g
144.0
118.4
CeO 2
4.0
LO
464.5
415.1
SnO 2
A 1g
637.5
613.8
InP
LO
347.0
333.5
ZnO
E 2g
441.5
380.0
CdS 0.65 Se 0.35
LO 1 CdSe-like
203.4
158.8
LO 2 CdS-like
303.0
257.7
CdSe
LO
21.0
195.2
CdS
LO
106.2
106.6
Bi 2 Se 3
A 2
1g
72.6
40.6
in the anisotropic graphite and graphene. Theoretical reproduction of the measured
Raman shift derived the bond nature index, the reference ω(1) as Table 23.1 listed.
The bond length and energy follow the BOLS regulation.
23.2.2.2 TiO 2
The anatase TiO 2 has six Raman active modes of 3E g (at 144, 196, and 639 cm
−1 ),
2B 1g (397 and 519 cm
−1 ), and 1A 1g (513 cm
−1 ). The rutile TiO 2 has four Raman
active modes of A 1g (612 cm
−1 ), B 1g (143 cm
−1 ), E g (447 cm
−1 ), and B 2g (826 cm
−1 ).
The A 1g (612 cm
−1 ) mode of rutile phase undergoes a redshift while the E g (144 cm
−1 )
mode of anatase phase undergoes a blueshift when the solid size is reduced [18–21].
The size trends of the phonon relaxation and the Yong’s modulus Y(K) follow the
linear dependence of the inverse size of the crystals but at slightly different slopes,
both of which are governed by the bond length and energy relaxation in the skin
subshells.
One can determine the m value; the ω(1), and its bulk shift ω(∞) − ω(1) from
matching the BOLS prediction to the measured/calculated size-reduction stiffened
Y(K) and the softened/stiffened Raman modes. The size-reduction induced Raman
E g mode blueshift is governed by the same mechanism of the graphene G mode
arising from dimer oscillator.