

450
23 Sized Crystals
Hence, the frequency shift from the reference dimer vibration frequency ω(1) to
the bulk value, ω(∞) − ω(1) = −A/( R K ), is a constant as R ∝ K
−1 . The γ i =
= τC i / K is the skin/bulk volume ratio and m is the bond nature index correlating bond energy to its length. One can obtain the reference frequency ω(1) given the
slope A of the experimental profile. The sum over the skin subshells represents that
the skin bond relaxation dictates the intrinsic while the size and geometry govern the
trends of the size dependency of the phonon frequency shift for nanostructures.
23.2.2 Skin Dominated Size Dependency
23.2.2.1 Group IV Nanocrystals
With the core-shell configuration and the known bulk frequency shifts as references,
one can reproduce the size dependence, or z-resolved Raman shift of nanostructures.
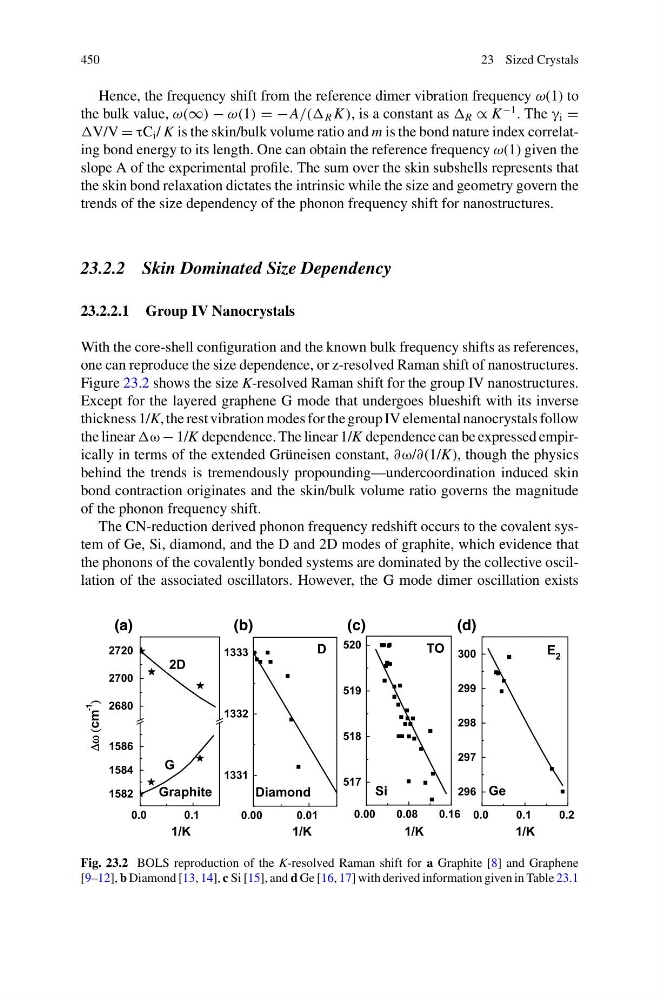
Figure 23.2 shows the size K-resolved Raman shift for the group IV nanostructures.
Except for the layered graphene G mode that undergoes blueshift with its inverse
thickness 1/K, the rest vibration modes for the group IV elemental nanocrystals follow
the linear − 1/K dependence. The linear 1/K dependence can be expressed empirically in terms of the extended Grüneisen constant, ∂ω/∂(1/K), though the physics
behind the trends is tremendously propounding—undercoordination induced skin
bond contraction originates and the skin/bulk volume ratio governs the magnitude
of the phonon frequency shift.
The CN-reduction derived phonon frequency redshift occurs to the covalent system of Ge, Si, diamond, and the D and 2D modes of graphite, which evidence that
the phonons of the covalently bonded systems are dominated by the collective oscillation of the associated oscillators. However, the G mode dimer oscillation exists
1331
1332
1333
Δω (cm
-1
)
Diamond
D
1582
1584
1586
2680
2700
2720
(a)
(b)
(c)
(d)
1/K
1/K
1/K
1/K
Graphite
2D
G
296
297
298
299
300
Ge
E 2
0.00
0.01
0.0
0.1
0.0
0.1
0.2
0.00
0.08
0.16
517
518
519
520
TO
Si
Fig. 23.2 BOLS reproduction of the K-resolved Raman shift for a Graphite [8] and Graphene
[9–12], b Diamond [13, 14], c Si [15], and d Ge [16, 17] with derived information given in Table 23.1
23 Sized Crystals
Hence, the frequency shift from the reference dimer vibration frequency ω(1) to
the bulk value, ω(∞) − ω(1) = −A/( R K ), is a constant as R ∝ K
−1 . The γ i =
= τC i / K is the skin/bulk volume ratio and m is the bond nature index correlating bond energy to its length. One can obtain the reference frequency ω(1) given the
slope A of the experimental profile. The sum over the skin subshells represents that
the skin bond relaxation dictates the intrinsic while the size and geometry govern the
trends of the size dependency of the phonon frequency shift for nanostructures.
23.2.2 Skin Dominated Size Dependency
23.2.2.1 Group IV Nanocrystals
With the core-shell configuration and the known bulk frequency shifts as references,
one can reproduce the size dependence, or z-resolved Raman shift of nanostructures.
Figure 23.2 shows the size K-resolved Raman shift for the group IV nanostructures.
Except for the layered graphene G mode that undergoes blueshift with its inverse
thickness 1/K, the rest vibration modes for the group IV elemental nanocrystals follow
the linear − 1/K dependence. The linear 1/K dependence can be expressed empirically in terms of the extended Grüneisen constant, ∂ω/∂(1/K), though the physics
behind the trends is tremendously propounding—undercoordination induced skin
bond contraction originates and the skin/bulk volume ratio governs the magnitude
of the phonon frequency shift.
The CN-reduction derived phonon frequency redshift occurs to the covalent system of Ge, Si, diamond, and the D and 2D modes of graphite, which evidence that
the phonons of the covalently bonded systems are dominated by the collective oscillation of the associated oscillators. However, the G mode dimer oscillation exists
1331
1332
1333
Δω (cm
-1
)
Diamond
D
1582
1584
1586
2680
2700
2720
(a)
(b)
(c)
(d)
1/K
1/K
1/K
1/K
Graphite
2D
G
296
297
298
299
300
Ge
E 2
0.00
0.01
0.0
0.1
0.0
0.1
0.2
0.00
0.08
0.16
517
518
519
520
TO
Si
Fig. 23.2 BOLS reproduction of the K-resolved Raman shift for a Graphite [8] and Graphene
[9–12], b Diamond [13, 14], c Si [15], and d Ge [16, 17] with derived information given in Table 23.1