

22.3 Numerical Reproduction of Phonon Relaxation
431
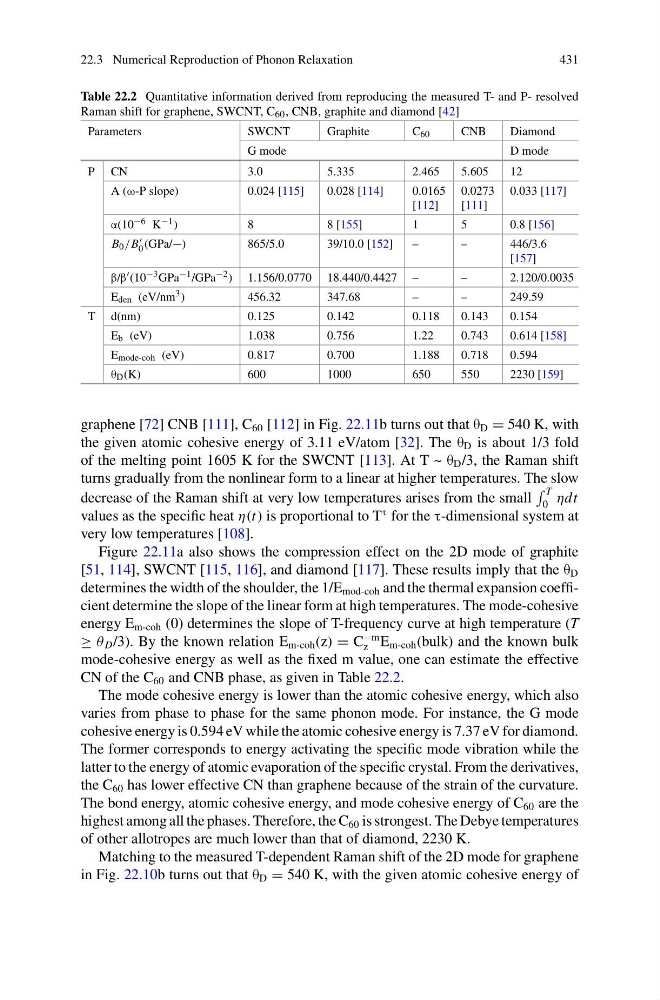
Table 22.2 Quantitative information derived from reproducing the measured T- and P- resolved
Raman shift for graphene, SWCNT, C 60 , CNB, graphite and diamond [42]
Parameters
SWCNT
Graphite
C 60
CNB
Diamond
G mode
D mode
P CN
3.0
5.335
2.465
5.605
12
A (ω-P slope)
0.024 [115]
0.028 [114]
0.0165
[112]
0.0273
[111]
0.033 [117]
α(10 −6 K −1 )
8
8 [155]
1
5
0.8 [156]
B 0 /B
0 (GPa/−)
865/5.0
39/10.0 [152]
–
–
446/3.6
[157]
β/β (10 −3 GPa −1 /GPa −2 ) 1.156/0.0770 18.440/0.4427 –
–
2.120/0.0035
E den (eV/nm 3 )
456.32
347.68
–
–
249.59
T d(nm)
0.125
0.142
0.118
0.143
0.154
E b (eV)
1.038
0.756
1.22
0.743
0.614 [158]
E mode-coh (eV)
0.817
0.700
1.188
0.718
0.594
θ D (K)
600
1000
650
550
2230 [159]
graphene [72] CNB [111], C 60 [112] in Fig. 22.11b turns out that θ D = 540 K, with
the given atomic cohesive energy of 3.11 eV/atom [32]. The θ D is about 1/3 fold
of the melting point 1605 K for the SWCNT [113]. At T ~ θ D /3, the Raman shift
turns gradually from the nonlinear form to a linear at higher temperatures. The slow
decrease of the Raman shift at very low temperatures arises from the small
T
0 ηdt
values as the specific heat η(t) is proportional to T
τ for the τ-dimensional system at
very low temperatures [108].
Figure 22.11a also shows the compression effect on the 2D mode of graphite
[51, 114], SWCNT [115, 116], and diamond [117]. These results imply that the θ D
determines the width of the shoulder, the 1/E mod-coh and the thermal expansion coefficient determine the slope of the linear form at high temperatures. The mode-cohesive
energy E m-coh (0) determines the slope of T-frequency curve at high temperature (T
≥ θ D /3). By the known relation E m-coh (z) = C
−m
z E m-coh (bulk) and the known bulk
mode-cohesive energy as well as the fixed m value, one can estimate the effective
CN of the C 60 and CNB phase, as given in Table 22.2.
The mode cohesive energy is lower than the atomic cohesive energy, which also
varies from phase to phase for the same phonon mode. For instance, the G mode
cohesive energy is 0.594 eV while the atomic cohesive energy is 7.37 eV for diamond.
The former corresponds to energy activating the specific mode vibration while the
latter to the energy of atomic evaporation of the specific crystal. From the derivatives,
the C 60 has lower effective CN than graphene because of the strain of the curvature.
The bond energy, atomic cohesive energy, and mode cohesive energy of C 60 are the
highest among all the phases. Therefore, the C 60 is strongest. The Debye temperatures
of other allotropes are much lower than that of diamond, 2230 K.
Matching to the measured T-dependent Raman shift of the 2D mode for graphene
in Fig. 22.10b turns out that θ D = 540 K, with the given atomic cohesive energy of
431
Table 22.2 Quantitative information derived from reproducing the measured T- and P- resolved
Raman shift for graphene, SWCNT, C 60 , CNB, graphite and diamond [42]
Parameters
SWCNT
Graphite
C 60
CNB
Diamond
G mode
D mode
P CN
3.0
5.335
2.465
5.605
12
A (ω-P slope)
0.024 [115]
0.028 [114]
0.0165
[112]
0.0273
[111]
0.033 [117]
α(10 −6 K −1 )
8
8 [155]
1
5
0.8 [156]
B 0 /B
0 (GPa/−)
865/5.0
39/10.0 [152]
–
–
446/3.6
[157]
β/β (10 −3 GPa −1 /GPa −2 ) 1.156/0.0770 18.440/0.4427 –
–
2.120/0.0035
E den (eV/nm 3 )
456.32
347.68
–
–
249.59
T d(nm)
0.125
0.142
0.118
0.143
0.154
E b (eV)
1.038
0.756
1.22
0.743
0.614 [158]
E mode-coh (eV)
0.817
0.700
1.188
0.718
0.594
θ D (K)
600
1000
650
550
2230 [159]
graphene [72] CNB [111], C 60 [112] in Fig. 22.11b turns out that θ D = 540 K, with
the given atomic cohesive energy of 3.11 eV/atom [32]. The θ D is about 1/3 fold
of the melting point 1605 K for the SWCNT [113]. At T ~ θ D /3, the Raman shift
turns gradually from the nonlinear form to a linear at higher temperatures. The slow
decrease of the Raman shift at very low temperatures arises from the small
T
0 ηdt
values as the specific heat η(t) is proportional to T
τ for the τ-dimensional system at
very low temperatures [108].
Figure 22.11a also shows the compression effect on the 2D mode of graphite
[51, 114], SWCNT [115, 116], and diamond [117]. These results imply that the θ D
determines the width of the shoulder, the 1/E mod-coh and the thermal expansion coefficient determine the slope of the linear form at high temperatures. The mode-cohesive
energy E m-coh (0) determines the slope of T-frequency curve at high temperature (T
≥ θ D /3). By the known relation E m-coh (z) = C
−m
z E m-coh (bulk) and the known bulk
mode-cohesive energy as well as the fixed m value, one can estimate the effective
CN of the C 60 and CNB phase, as given in Table 22.2.
The mode cohesive energy is lower than the atomic cohesive energy, which also
varies from phase to phase for the same phonon mode. For instance, the G mode
cohesive energy is 0.594 eV while the atomic cohesive energy is 7.37 eV for diamond.
The former corresponds to energy activating the specific mode vibration while the
latter to the energy of atomic evaporation of the specific crystal. From the derivatives,
the C 60 has lower effective CN than graphene because of the strain of the curvature.
The bond energy, atomic cohesive energy, and mode cohesive energy of C 60 are the
highest among all the phases. Therefore, the C 60 is strongest. The Debye temperatures
of other allotropes are much lower than that of diamond, 2230 K.
Matching to the measured T-dependent Raman shift of the 2D mode for graphene
in Fig. 22.10b turns out that θ D = 540 K, with the given atomic cohesive energy of