

430
22 Layered Structures
468
470
472
BP - 1
BP - 2
BOLS
A 2g
440
445
450
B 2g
0
2
4
6
8
360
370
380
390
P (GPa)
A g
1
465
468
471
(cm -1
)
(cm -1
)
Experiment
T- BOLS
A g
2
435
438
441
444
B 2g
0
100
200
300 400
500 600
360
362
364
T (K)
A g
1
(a)
(b)
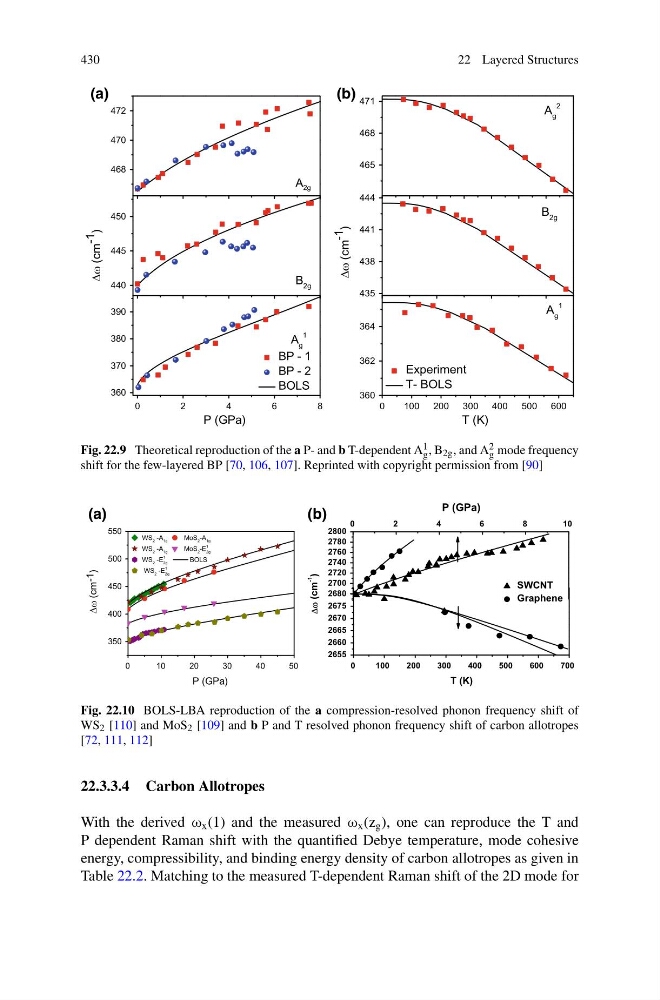
Fig. 22.9 Theoretical reproduction of the a P- and b T-dependent A 1
g , B 2g , and A 2
g mode frequency
shift for the few-layered BP [70, 106, 107]. Reprinted with copyright permission from [90]
350
400
450
500
550
(cm -1
)
P (GPa)
WS 2 -A 1g
MoS 2 -A 1g
WS 2 -A 1g
MoS 2 -E 1
2g
WS 2 -E 1
2g
BOLS
WS 2 -E 1
2g
2700
2720
2740
2760
2780
2800
0
2
4
6
8
1 0
(cm
-1
)
SWCNT
Graphene
P (GPa)
0
1 0
2 0
3 0
4 0
5 0
0
100
200
300
400
500
600
700
2655
2660
2665
2670
2675
2680
T (K)
(a)
(b)
Fig. 22.10 BOLS-LBA reproduction of the a compression-resolved phonon frequency shift of
WS 2 [110] and MoS 2 [109] and b P and T resolved phonon frequency shift of carbon allotropes
[72, 111, 112]
22.3.3.4 Carbon Allotropes
With the derived ω x (1) and the measured ω x (z g ), one can reproduce the T and
P dependent Raman shift with the quantified Debye temperature, mode cohesive
energy, compressibility, and binding energy density of carbon allotropes as given in
Table 22.2. Matching to the measured T-dependent Raman shift of the 2D mode for
22 Layered Structures
468
470
472
BP - 1
BP - 2
BOLS
A 2g
440
445
450
B 2g
0
2
4
6
8
360
370
380
390
P (GPa)
A g
1
465
468
471
(cm -1
)
(cm -1
)
Experiment
T- BOLS
A g
2
435
438
441
444
B 2g
0
100
200
300 400
500 600
360
362
364
T (K)
A g
1
(a)
(b)
Fig. 22.9 Theoretical reproduction of the a P- and b T-dependent A 1
g , B 2g , and A 2
g mode frequency
shift for the few-layered BP [70, 106, 107]. Reprinted with copyright permission from [90]
350
400
450
500
550
(cm -1
)
P (GPa)
WS 2 -A 1g
MoS 2 -A 1g
WS 2 -A 1g
MoS 2 -E 1
2g
WS 2 -E 1
2g
BOLS
WS 2 -E 1
2g
2700
2720
2740
2760
2780
2800
0
2
4
6
8
1 0
(cm
-1
)
SWCNT
Graphene
P (GPa)
0
1 0
2 0
3 0
4 0
5 0
0
100
200
300
400
500
600
700
2655
2660
2665
2670
2675
2680
T (K)
(a)
(b)
Fig. 22.10 BOLS-LBA reproduction of the a compression-resolved phonon frequency shift of
WS 2 [110] and MoS 2 [109] and b P and T resolved phonon frequency shift of carbon allotropes
[72, 111, 112]
22.3.3.4 Carbon Allotropes
With the derived ω x (1) and the measured ω x (z g ), one can reproduce the T and
P dependent Raman shift with the quantified Debye temperature, mode cohesive
energy, compressibility, and binding energy density of carbon allotropes as given in
Table 22.2. Matching to the measured T-dependent Raman shift of the 2D mode for