

396
21 Theory: Multifield Oscillation Dynamics
Table 21.1 Correlation between the macroscopic detectable quantities and the Taylor series
coefficients
Microscopic q
Bond identities
Macroscopically detectable
Q
No
E z = U (d)
Bond energy E z
Core level shift ν , band
gap E G ,
(7.1)
dU (r )
dr
r =d
= 0 ∝
E
d
Bond length d
Mass density d 3 , strain
d/d
(7.2)
f = −
dU (r )
dr
At non-equilibrium
Force
(7.3)
p ∝ −
dU (r )
r 2 dr
∝
U (r )
r 3
Pressure −
∂U (r )
∂r /
∂ V
∂r
(7.4)
κ =
dU (r )
dr 2
r =d
∝
E
d 2
Force constant k
Bond stiffness Yd, dimer
vibration frequency:
ω = k/μ =
E/μd 2 1/2 ∝
(Y d) 1/2
(7.5)
B ∝
d 3 U (r )
dr 3
r =d
∝
E
d 3
Energy density E den
Elastic modulus
B, Y ∝ −V
∂ P
∂ V
(7.6)
T C ∝ zE z
Atomic cohesive energy
E coh
Critical temperature for
phase transition; energy
band width E ν,w ∝ 2zE z
(7.7)
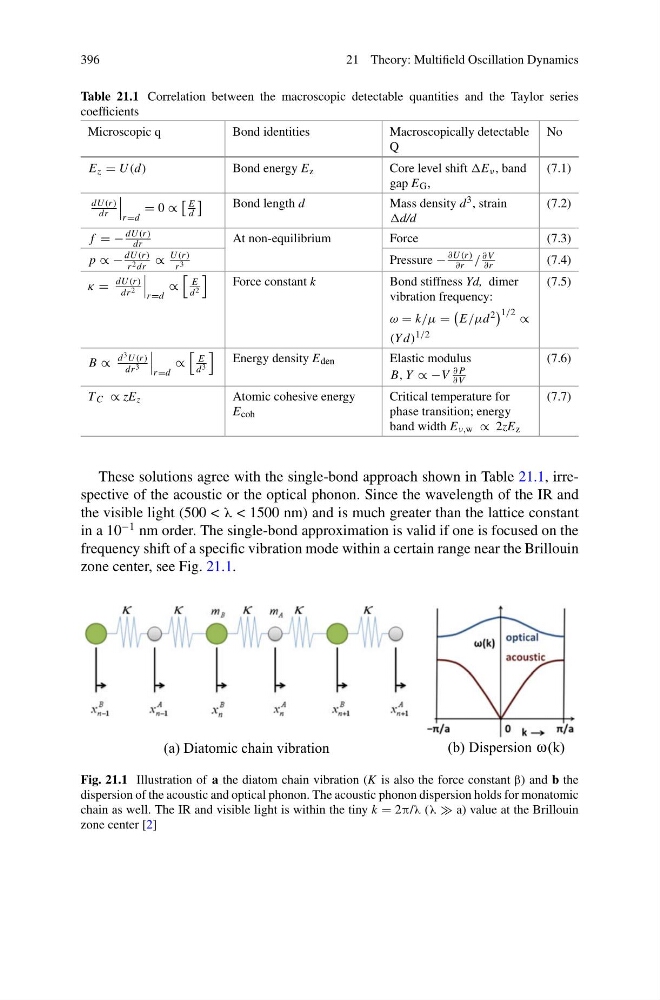
These solutions agree with the single-bond approach shown in Table 21.1, irrespective of the acoustic or the optical phonon. Since the wavelength of the IR and
the visible light (500 < λ < 1500 nm) and is much greater than the lattice constant
in a 10
−1 nm order. The single-bond approximation is valid if one is focused on the
frequency shift of a specific vibration mode within a certain range near the Brillouin
zone center, see Fig. 21.1.
(a) Diatomic chain vibration
(b) Dispersion (k)
ω
Fig. 21.1 Illustration of a the diatom chain vibration (K is also the force constant β) and b the
dispersion of the acoustic and optical phonon. The acoustic phonon dispersion holds for monatomic
chain as well. The IR and visible light is within the tiny k = 2π/λ (λ a) value at the Brillouin
zone center [2]
21 Theory: Multifield Oscillation Dynamics
Table 21.1 Correlation between the macroscopic detectable quantities and the Taylor series
coefficients
Microscopic q
Bond identities
Macroscopically detectable
Q
No
E z = U (d)
Bond energy E z
Core level shift ν , band
gap E G ,
(7.1)
dU (r )
dr
r =d
= 0 ∝
E
d
Bond length d
Mass density d 3 , strain
d/d
(7.2)
f = −
dU (r )
dr
At non-equilibrium
Force
(7.3)
p ∝ −
dU (r )
r 2 dr
∝
U (r )
r 3
Pressure −
∂U (r )
∂r /
∂ V
∂r
(7.4)
κ =
dU (r )
dr 2
r =d
∝
E
d 2
Force constant k
Bond stiffness Yd, dimer
vibration frequency:
ω = k/μ =
E/μd 2 1/2 ∝
(Y d) 1/2
(7.5)
B ∝
d 3 U (r )
dr 3
r =d
∝
E
d 3
Energy density E den
Elastic modulus
B, Y ∝ −V
∂ P
∂ V
(7.6)
T C ∝ zE z
Atomic cohesive energy
E coh
Critical temperature for
phase transition; energy
band width E ν,w ∝ 2zE z
(7.7)
These solutions agree with the single-bond approach shown in Table 21.1, irrespective of the acoustic or the optical phonon. Since the wavelength of the IR and
the visible light (500 < λ < 1500 nm) and is much greater than the lattice constant
in a 10
−1 nm order. The single-bond approximation is valid if one is focused on the
frequency shift of a specific vibration mode within a certain range near the Brillouin
zone center, see Fig. 21.1.
(a) Diatomic chain vibration
(b) Dispersion (k)
ω
Fig. 21.1 Illustration of a the diatom chain vibration (K is also the force constant β) and b the
dispersion of the acoustic and optical phonon. The acoustic phonon dispersion holds for monatomic
chain as well. The IR and visible light is within the tiny k = 2π/λ (λ a) value at the Brillouin
zone center [2]