

20.4 Overview on Theoretical Progress
383
contraction by thermal-expansion mismatching the matrix to the crystal, and the
second term arises from the increase of surface tension with the decrease of crystal
size. Substituting Eq. (20.3) into (20.2), yields,
ω(K )
ω L
= −3γ
α
− α
T − T g
−
1
2
β L μ np
ω L
2
− γβ C b
(K d 0 )
−2
= A − B K
−2
(20.4)
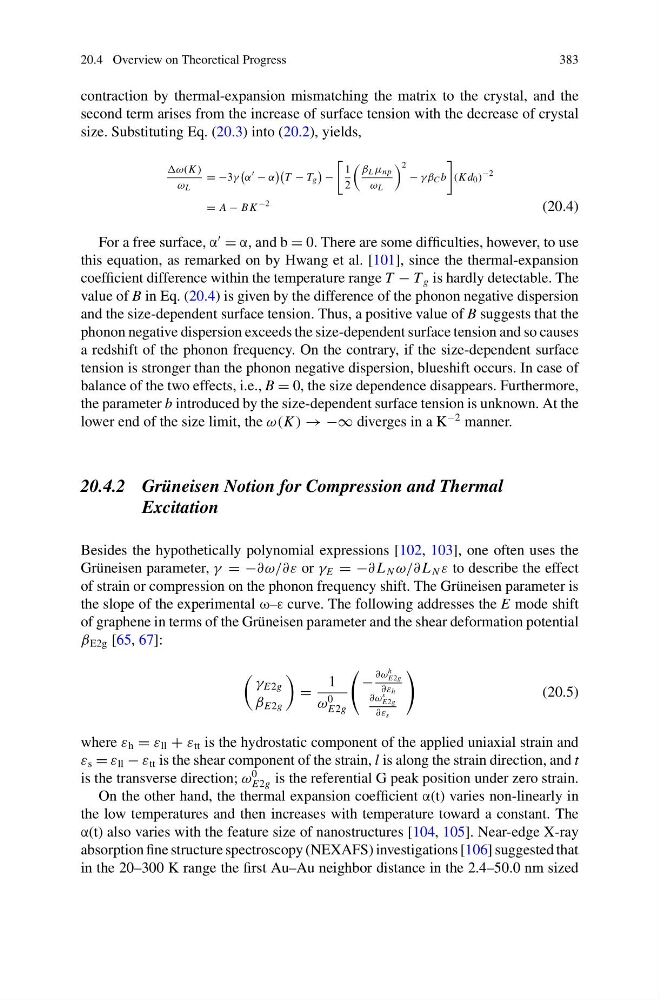
For a free surface, α
= α, and b = 0. There are some difficulties, however, to use
this equation, as remarked on by Hwang et al. [101], since the thermal-expansion
coefficient difference within the temperature range T − T g is hardly detectable. The
value of B in Eq. (20.4) is given by the difference of the phonon negative dispersion
and the size-dependent surface tension. Thus, a positive value of B suggests that the
phonon negative dispersion exceeds the size-dependent surface tension and so causes
a redshift of the phonon frequency. On the contrary, if the size-dependent surface
tension is stronger than the phonon negative dispersion, blueshift occurs. In case of
balance of the two effects, i.e., B = 0, the size dependence disappears. Furthermore,
the parameter b introduced by the size-dependent surface tension is unknown. At the
lower end of the size limit, the ω(K ) → −∞ diverges in a K
−2 manner.
20.4.2 Grüneisen Notion for Compression and Thermal
Excitation
Besides the hypothetically polynomial expressions [102, 103], one often uses the
Grüneisen parameter, γ = −∂ω/∂ε or γ E = −∂ L N ω/∂ L N ε to describe the effect
of strain or compression on the phonon frequency shift. The Grüneisen parameter is
the slope of the experimental ω–ε curve. The following addresses the E mode shift
of graphene in terms of the Grüneisen parameter and the shear deformation potential
β E2g [65, 67]:
γ E2g
β E2g
=
1
ω
0
E2g
−
∂ω
h
E2g
∂ε h
∂ω
s
E2g
∂ε s
(20.5)
where ε h = ε ll + ε tt is the hydrostatic component of the applied uniaxial strain and
ε s = ε ll − ε tt is the shear component of the strain, l is along the strain direction, and t
is the transverse direction; ω
0
E2g is the referential G peak position under zero strain.
On the other hand, the thermal expansion coefficient α(t) varies non-linearly in
the low temperatures and then increases with temperature toward a constant. The
α(t) also varies with the feature size of nanostructures [104, 105]. Near-edge X-ray
absorption fine structure spectroscopy (NEXAFS) investigations [106] suggested that
in the 20–300 K range the first Au–Au neighbor distance in the 2.4–50.0 nm sized
383
contraction by thermal-expansion mismatching the matrix to the crystal, and the
second term arises from the increase of surface tension with the decrease of crystal
size. Substituting Eq. (20.3) into (20.2), yields,
ω(K )
ω L
= −3γ
α
− α
T − T g
−
1
2
β L μ np
ω L
2
− γβ C b
(K d 0 )
−2
= A − B K
−2
(20.4)
For a free surface, α
= α, and b = 0. There are some difficulties, however, to use
this equation, as remarked on by Hwang et al. [101], since the thermal-expansion
coefficient difference within the temperature range T − T g is hardly detectable. The
value of B in Eq. (20.4) is given by the difference of the phonon negative dispersion
and the size-dependent surface tension. Thus, a positive value of B suggests that the
phonon negative dispersion exceeds the size-dependent surface tension and so causes
a redshift of the phonon frequency. On the contrary, if the size-dependent surface
tension is stronger than the phonon negative dispersion, blueshift occurs. In case of
balance of the two effects, i.e., B = 0, the size dependence disappears. Furthermore,
the parameter b introduced by the size-dependent surface tension is unknown. At the
lower end of the size limit, the ω(K ) → −∞ diverges in a K
−2 manner.
20.4.2 Grüneisen Notion for Compression and Thermal
Excitation
Besides the hypothetically polynomial expressions [102, 103], one often uses the
Grüneisen parameter, γ = −∂ω/∂ε or γ E = −∂ L N ω/∂ L N ε to describe the effect
of strain or compression on the phonon frequency shift. The Grüneisen parameter is
the slope of the experimental ω–ε curve. The following addresses the E mode shift
of graphene in terms of the Grüneisen parameter and the shear deformation potential
β E2g [65, 67]:
γ E2g
β E2g
=
1
ω
0
E2g
−
∂ω
h
E2g
∂ε h
∂ω
s
E2g
∂ε s
(20.5)
where ε h = ε ll + ε tt is the hydrostatic component of the applied uniaxial strain and
ε s = ε ll − ε tt is the shear component of the strain, l is along the strain direction, and t
is the transverse direction; ω
0
E2g is the referential G peak position under zero strain.
On the other hand, the thermal expansion coefficient α(t) varies non-linearly in
the low temperatures and then increases with temperature toward a constant. The
α(t) also varies with the feature size of nanostructures [104, 105]. Near-edge X-ray
absorption fine structure spectroscopy (NEXAFS) investigations [106] suggested that
in the 20–300 K range the first Au–Au neighbor distance in the 2.4–50.0 nm sized