

17.3 Bond Geometry, Valence DOS, and 3D-SPB
337
-2.5
-3.5
-2.5
-2.5
-2.5
-2.5
-3.0
Energy (eV)
0
23.5
63.5
(b) z (E)
(a.u.)
0
I
I
00
0
63.5
53.5
43.5
23.5
33.5
(%)
5
10
o
7.5
12.5
1
5
1
23.5
63.5
φ L
(c) ImV(E, )
a
b
c
d
7.5
12.5
12.5
7.5
(a) I = I
c
m
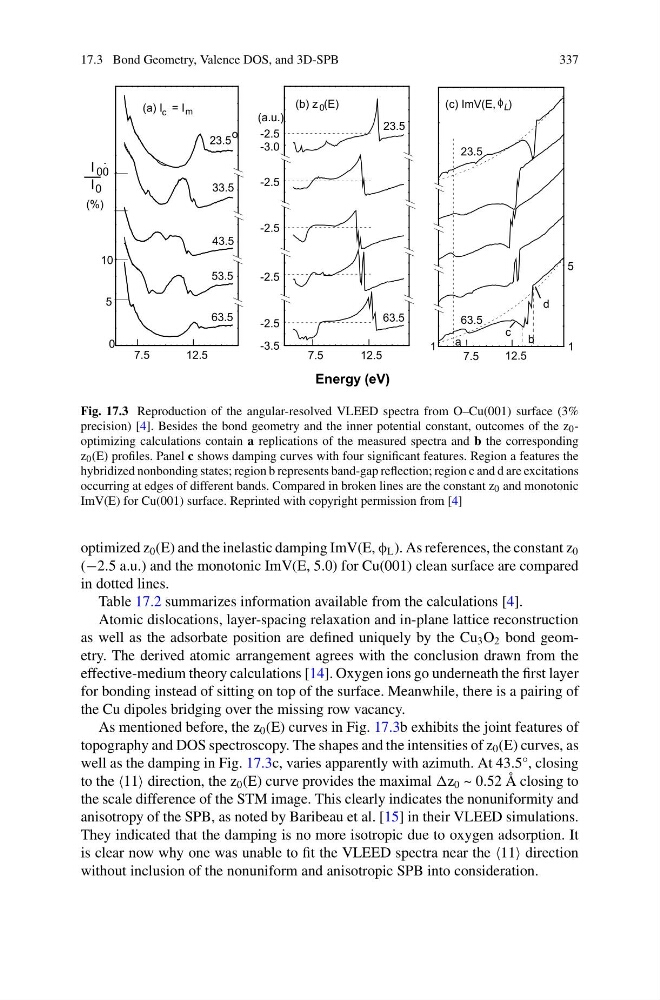
Fig. 17.3 Reproduction of the angular-resolved VLEED spectra from O–Cu(001) surface (3%
precision) [4]. Besides the bond geometry and the inner potential constant, outcomes of the z 0 -
optimizing calculations contain a replications of the measured spectra and b the corresponding
z 0 (E) profiles. Panel c shows damping curves with four significant features. Region a features the
hybridized nonbonding states; region b represents band-gap reflection; region c and d are excitations
occurring at edges of different bands. Compared in broken lines are the constant z 0 and monotonic
ImV(E) for Cu(001) surface. Reprinted with copyright permission from [4]
optimized z 0 (E) and the inelastic damping ImV(E, φ L ). As references, the constant z 0
(−2.5 a.u.) and the monotonic ImV(E, 5.0) for Cu(001) clean surface are compared
in dotted lines.
Table 17.2 summarizes information available from the calculations [4].
Atomic dislocations, layer-spacing relaxation and in-plane lattice reconstruction
as well as the adsorbate position are defined uniquely by the Cu 3 O 2 bond geometry. The derived atomic arrangement agrees with the conclusion drawn from the
effective-medium theory calculations [14]. Oxygen ions go underneath the first layer
for bonding instead of sitting on top of the surface. Meanwhile, there is a pairing of
the Cu dipoles bridging over the missing row vacancy.
As mentioned before, the z 0 (E) curves in Fig. 17.3b exhibits the joint features of
topography and DOS spectroscopy. The shapes and the intensities of z 0 (E) curves, as
well as the damping in Fig. 17.3c, varies apparently with azimuth. At 43.5°, closing
to the 11 direction, the z 0 (E) curve provides the maximal 0 ~ 0.52 Å closing to
the scale difference of the STM image. This clearly indicates the nonuniformity and
anisotropy of the SPB, as noted by Baribeau et al. [15] in their VLEED simulations.
They indicated that the damping is no more isotropic due to oxygen adsorption. It
is clear now why one was unable to fit the VLEED spectra near the 11 direction
without inclusion of the nonuniform and anisotropic SPB into consideration.
337
-2.5
-3.5
-2.5
-2.5
-2.5
-2.5
-3.0
Energy (eV)
0
23.5
63.5
(b) z (E)
(a.u.)
0
I
I
00
0
63.5
53.5
43.5
23.5
33.5
(%)
5
10
o
7.5
12.5
1
5
1
23.5
63.5
φ L
(c) ImV(E, )
a
b
c
d
7.5
12.5
12.5
7.5
(a) I = I
c
m
Fig. 17.3 Reproduction of the angular-resolved VLEED spectra from O–Cu(001) surface (3%
precision) [4]. Besides the bond geometry and the inner potential constant, outcomes of the z 0 -
optimizing calculations contain a replications of the measured spectra and b the corresponding
z 0 (E) profiles. Panel c shows damping curves with four significant features. Region a features the
hybridized nonbonding states; region b represents band-gap reflection; region c and d are excitations
occurring at edges of different bands. Compared in broken lines are the constant z 0 and monotonic
ImV(E) for Cu(001) surface. Reprinted with copyright permission from [4]
optimized z 0 (E) and the inelastic damping ImV(E, φ L ). As references, the constant z 0
(−2.5 a.u.) and the monotonic ImV(E, 5.0) for Cu(001) clean surface are compared
in dotted lines.
Table 17.2 summarizes information available from the calculations [4].
Atomic dislocations, layer-spacing relaxation and in-plane lattice reconstruction
as well as the adsorbate position are defined uniquely by the Cu 3 O 2 bond geometry. The derived atomic arrangement agrees with the conclusion drawn from the
effective-medium theory calculations [14]. Oxygen ions go underneath the first layer
for bonding instead of sitting on top of the surface. Meanwhile, there is a pairing of
the Cu dipoles bridging over the missing row vacancy.
As mentioned before, the z 0 (E) curves in Fig. 17.3b exhibits the joint features of
topography and DOS spectroscopy. The shapes and the intensities of z 0 (E) curves, as
well as the damping in Fig. 17.3c, varies apparently with azimuth. At 43.5°, closing
to the 11 direction, the z 0 (E) curve provides the maximal 0 ~ 0.52 Å closing to
the scale difference of the STM image. This clearly indicates the nonuniformity and
anisotropy of the SPB, as noted by Baribeau et al. [15] in their VLEED simulations.
They indicated that the damping is no more isotropic due to oxygen adsorption. It
is clear now why one was unable to fit the VLEED spectra near the 11 direction
without inclusion of the nonuniform and anisotropic SPB into consideration.