

16.1 Uniqueness of Solution
319
E=6.3 eV
E=7.3 eV
E=8.3 eV
E=9.3 eV
E=10.3 eV
E=11.3 eV
α
z 1
(a.u.)
0.2
1.0
1.8
2.6
3.4 0.2
1.0
1.8
2.6
3.4
0.95
1
1.05
-0.2
-1.0
-1.8
-2.6
-3.4
-1.0
-1.8
-2.6
-3.4
-1.0
-1.8
-2.6
-3.4
-0.2
1
1.05
0.2
1.8
2.6
3.4
1.0
1.0
1.8
2.6
3.4
1
1.05
(a.u.)
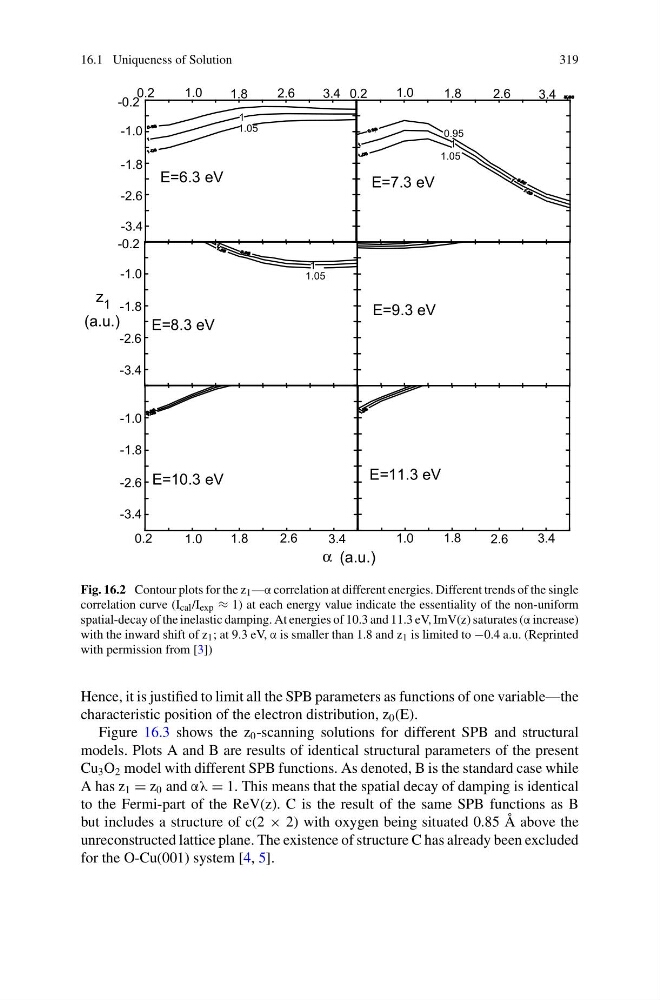
Fig. 16.2 Contour plots for the z 1 —α correlation at different energies. Different trends of the single
correlation curve (I cal /I exp ≈ 1) at each energy value indicate the essentiality of the non-uniform
spatial-decay of the inelastic damping. At energies of 10.3 and 11.3 eV, ImV(z) saturates (α increase)
with the inward shift of z 1 ; at 9.3 eV, α is smaller than 1.8 and z 1 is limited to −0.4 a.u. (Reprinted
with permission from [3])
Hence, it is justified to limit all the SPB parameters as functions of one variable—the
characteristic position of the electron distribution, z 0 (E).
Figure 16.3 shows the z 0 -scanning solutions for different SPB and structural
models. Plots A and B are results of identical structural parameters of the present
Cu 3 O 2 model with different SPB functions. As denoted, B is the standard case while
A has z 1 = z 0 and αλ = 1. This means that the spatial decay of damping is identical
to the Fermi-part of the ReV(z). C is the result of the same SPB functions as B
but includes a structure of c(2 × 2) with oxygen being situated 0.85 Å above the
unreconstructed lattice plane. The existence of structure C has already been excluded
for the O-Cu(001) system [4, 5].
319
E=6.3 eV
E=7.3 eV
E=8.3 eV
E=9.3 eV
E=10.3 eV
E=11.3 eV
α
z 1
(a.u.)
0.2
1.0
1.8
2.6
3.4 0.2
1.0
1.8
2.6
3.4
0.95
1
1.05
-0.2
-1.0
-1.8
-2.6
-3.4
-1.0
-1.8
-2.6
-3.4
-1.0
-1.8
-2.6
-3.4
-0.2
1
1.05
0.2
1.8
2.6
3.4
1.0
1.0
1.8
2.6
3.4
1
1.05
(a.u.)
Fig. 16.2 Contour plots for the z 1 —α correlation at different energies. Different trends of the single
correlation curve (I cal /I exp ≈ 1) at each energy value indicate the essentiality of the non-uniform
spatial-decay of the inelastic damping. At energies of 10.3 and 11.3 eV, ImV(z) saturates (α increase)
with the inward shift of z 1 ; at 9.3 eV, α is smaller than 1.8 and z 1 is limited to −0.4 a.u. (Reprinted
with permission from [3])
Hence, it is justified to limit all the SPB parameters as functions of one variable—the
characteristic position of the electron distribution, z 0 (E).
Figure 16.3 shows the z 0 -scanning solutions for different SPB and structural
models. Plots A and B are results of identical structural parameters of the present
Cu 3 O 2 model with different SPB functions. As denoted, B is the standard case while
A has z 1 = z 0 and αλ = 1. This means that the spatial decay of damping is identical
to the Fermi-part of the ReV(z). C is the result of the same SPB functions as B
but includes a structure of c(2 × 2) with oxygen being situated 0.85 Å above the
unreconstructed lattice plane. The existence of structure C has already been excluded
for the O-Cu(001) system [4, 5].