

9.2 ARPES: Holes, Nonbonding and Bonding States
185
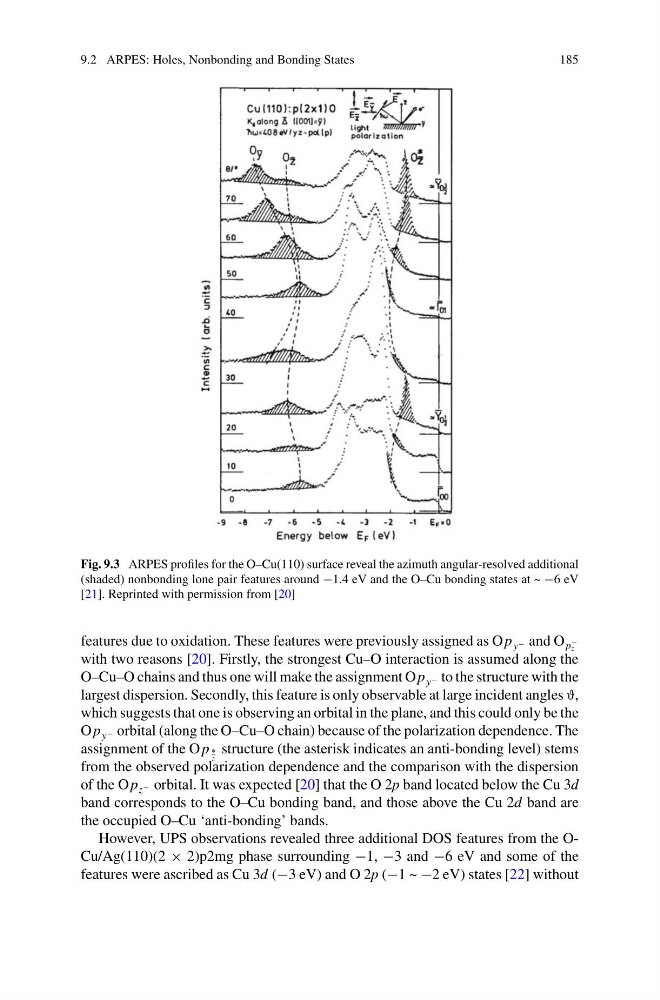
Fig. 9.3 ARPES profiles for the O–Cu(110) surface reveal the azimuth angular-resolved additional
(shaded) nonbonding lone pair features around −1.4 eV and the O–Cu bonding states at ~ −6 eV
[21]. Reprinted with permission from [20]
features due to oxidation. These features were previously assigned as O p y − and O p
−
z
with two reasons [20]. Firstly, the strongest Cu–O interaction is assumed along the
O–Cu–O chains and thus one will make the assignment O p y − to the structure with the
largest dispersion. Secondly, this feature is only observable at large incident angles ϑ,
which suggests that one is observing an orbital in the plane, and this could only be the
O p y − orbital (along the O–Cu–O chain) because of the polarization dependence. The
assignment of the O p ∗
z
structure (the asterisk indicates an anti-bonding level) stems
from the observed polarization dependence and the comparison with the dispersion
of the O p z − orbital. It was expected [20] that the O 2p band located below the Cu 3d
band corresponds to the O–Cu bonding band, and those above the Cu 2d band are
the occupied O–Cu ‘anti-bonding’ bands.
However, UPS observations revealed three additional DOS features from the OCu/Ag(110)(2 × 2)p2mg phase surrounding −1, −3 and −6 eV and some of the
features were ascribed as Cu 3d (−3 eV) and O 2p (−1 ~ −2 eV) states [22] without
185
Fig. 9.3 ARPES profiles for the O–Cu(110) surface reveal the azimuth angular-resolved additional
(shaded) nonbonding lone pair features around −1.4 eV and the O–Cu bonding states at ~ −6 eV
[21]. Reprinted with permission from [20]
features due to oxidation. These features were previously assigned as O p y − and O p
−
z
with two reasons [20]. Firstly, the strongest Cu–O interaction is assumed along the
O–Cu–O chains and thus one will make the assignment O p y − to the structure with the
largest dispersion. Secondly, this feature is only observable at large incident angles ϑ,
which suggests that one is observing an orbital in the plane, and this could only be the
O p y − orbital (along the O–Cu–O chain) because of the polarization dependence. The
assignment of the O p ∗
z
structure (the asterisk indicates an anti-bonding level) stems
from the observed polarization dependence and the comparison with the dispersion
of the O p z − orbital. It was expected [20] that the O 2p band located below the Cu 3d
band corresponds to the O–Cu bonding band, and those above the Cu 2d band are
the occupied O–Cu ‘anti-bonding’ bands.
However, UPS observations revealed three additional DOS features from the OCu/Ag(110)(2 × 2)p2mg phase surrounding −1, −3 and −6 eV and some of the
features were ascribed as Cu 3d (−3 eV) and O 2p (−1 ~ −2 eV) states [22] without