

120
6 Atomic Chains, Clusters, and Nanocrystals
6.6.3 BOLS-TB-ZPS Formulation and Derivatives
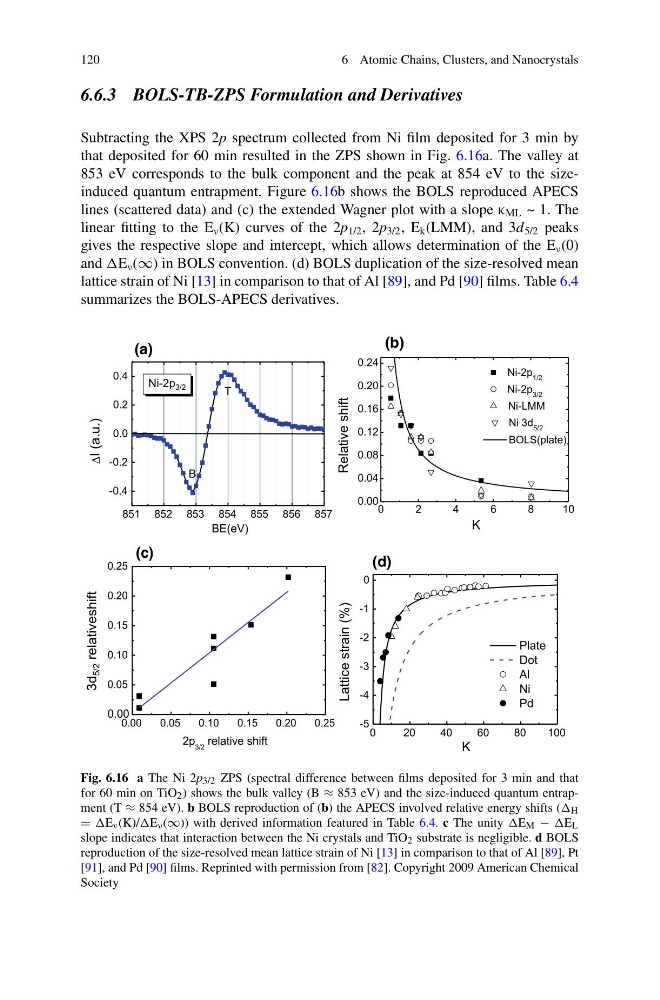
Subtracting the XPS 2p spectrum collected from Ni film deposited for 3 min by
that deposited for 60 min resulted in the ZPS shown in Fig. 6.16a. The valley at
853 eV corresponds to the bulk component and the peak at 854 eV to the sizeinduced quantum entrapment. Figure 6.16b shows the BOLS reproduced APECS
lines (scattered data) and (c) the extended Wagner plot with a slope κ ML ~ 1. The
linear fitting to the E ν (K) curves of the 2p 1/2 , 2p 3/2 , E k (LMM), and 3d 5/2 peaks
gives the respective slope and intercept, which allows determination of the E ν (0)
and ν (∞) in BOLS convention. (d) BOLS duplication of the size-resolved mean
lattice strain of Ni [13] in comparison to that of Al [89], and Pd [90] films. Table 6.4
summarizes the BOLS-APECS derivatives.
851 852 853 854 855 856 857
-0.4
-0.2
0.0
0.2
0.4
Ni-2p 3/2
ΔI (a.u.)
BE(eV)
(a)
T
B
0
2
4
6
8
1 0
0.00
0.04
0.08
0.12
0.16
0.20
0.24
Ni 3d 5/2
BOLS(plate)
Ni-2p 1/2
Ni-2p 3/2
Ni-LMM
Relative shift
K
(b)
0.00
0.05
0.10
0.15
0.20
0.25
0.00
0.05
0.10
0.15
0.20
0.25
2p 3/2 relative shift
3d
5/2 relativeshift
(c)
0
2 0
4 0
6 0
8 0
1 0 0
-5
-4
-3
-2
-1
0
(d)
Lattice strain (%)
K
Plate
Dot
Al
Ni
Pd
Fig. 6.16 a The Ni 2p 3/2 ZPS (spectral difference between films deposited for 3 min and that
for 60 min on TiO 2 ) shows the bulk valley (B ≈ 853 eV) and the size-induced quantum entrapment (T ≈ 854 eV). b BOLS reproduction of (b) the APECS involved relative energy shifts ( H
= ν (K)/ ν (∞)) with derived information featured in Table 6.4. c The unity M − L
slope indicates that interaction between the Ni crystals and TiO 2 substrate is negligible. d BOLS
reproduction of the size-resolved mean lattice strain of Ni [13] in comparison to that of Al [89], Pt
[91], and Pd [90] films. Reprinted with permission from [82]. Copyright 2009 American Chemical
Society
6 Atomic Chains, Clusters, and Nanocrystals
6.6.3 BOLS-TB-ZPS Formulation and Derivatives
Subtracting the XPS 2p spectrum collected from Ni film deposited for 3 min by
that deposited for 60 min resulted in the ZPS shown in Fig. 6.16a. The valley at
853 eV corresponds to the bulk component and the peak at 854 eV to the sizeinduced quantum entrapment. Figure 6.16b shows the BOLS reproduced APECS
lines (scattered data) and (c) the extended Wagner plot with a slope κ ML ~ 1. The
linear fitting to the E ν (K) curves of the 2p 1/2 , 2p 3/2 , E k (LMM), and 3d 5/2 peaks
gives the respective slope and intercept, which allows determination of the E ν (0)
and ν (∞) in BOLS convention. (d) BOLS duplication of the size-resolved mean
lattice strain of Ni [13] in comparison to that of Al [89], and Pd [90] films. Table 6.4
summarizes the BOLS-APECS derivatives.
851 852 853 854 855 856 857
-0.4
-0.2
0.0
0.2
0.4
Ni-2p 3/2
ΔI (a.u.)
BE(eV)
(a)
T
B
0
2
4
6
8
1 0
0.00
0.04
0.08
0.12
0.16
0.20
0.24
Ni 3d 5/2
BOLS(plate)
Ni-2p 1/2
Ni-2p 3/2
Ni-LMM
Relative shift
K
(b)
0.00
0.05
0.10
0.15
0.20
0.25
0.00
0.05
0.10
0.15
0.20
0.25
2p 3/2 relative shift
3d
5/2 relativeshift
(c)
0
2 0
4 0
6 0
8 0
1 0 0
-5
-4
-3
-2
-1
0
(d)
Lattice strain (%)
K
Plate
Dot
Al
Ni
Pd
Fig. 6.16 a The Ni 2p 3/2 ZPS (spectral difference between films deposited for 3 min and that
for 60 min on TiO 2 ) shows the bulk valley (B ≈ 853 eV) and the size-induced quantum entrapment (T ≈ 854 eV). b BOLS reproduction of (b) the APECS involved relative energy shifts ( H
= ν (K)/ ν (∞)) with derived information featured in Table 6.4. c The unity M − L
slope indicates that interaction between the Ni crystals and TiO 2 substrate is negligible. d BOLS
reproduction of the size-resolved mean lattice strain of Ni [13] in comparison to that of Al [89], Pt
[91], and Pd [90] films. Reprinted with permission from [82]. Copyright 2009 American Chemical
Society