

6.6 Nickel
121
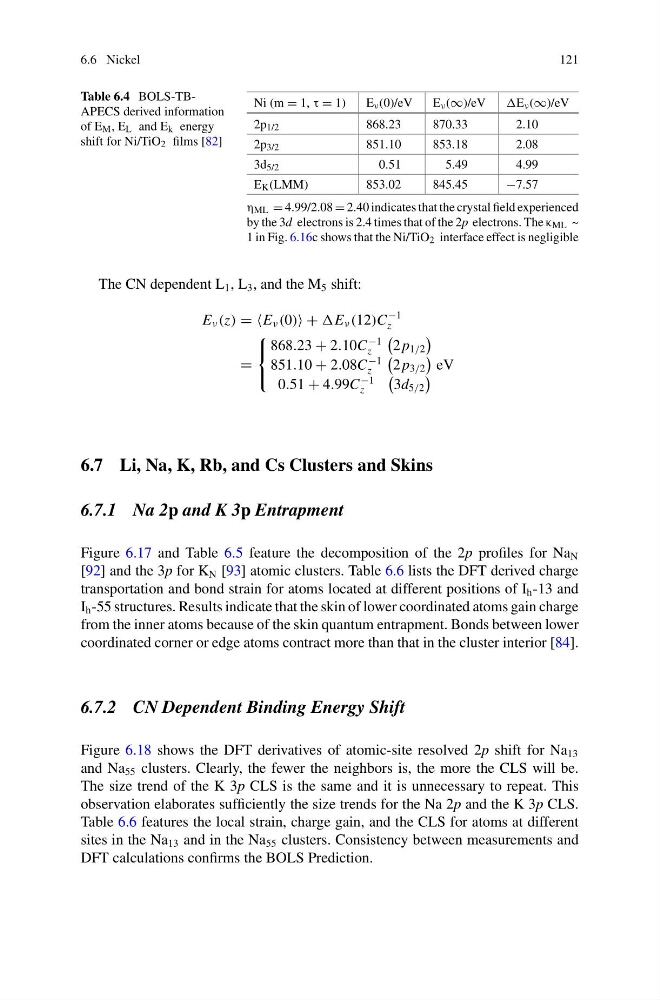
Table 6.4 BOLS-TBAPECS derived information
of E M , E L and E k energy
shift for Ni/TiO 2 films [82]
Ni (m = 1, τ = 1)
E ν (0)/eV
E ν (∞)/eV
E ν (∞)/eV
2p 1/2
868.23
870.33
2.10
2p 3/2
851.10
853.18
2.08
3d 5/2
0.51
5.49
4.99
E K (LMM)
853.02
845.45
−7.57
η ML = 4.99/2.08 = 2.40 indicates that the crystal field experienced
by the 3d electrons is 2.4 times that of the 2p electrons. The κ ML ~
1 in Fig. 6.16c shows that the Ni/TiO 2 interface effect is negligible
The CN dependent L 1 , L 3 , and the M 5 shift:
E ν (z) = E ν (0) + E ν (12)C
−1
z
=
⎧
⎨
⎩
868.23 + 2.10C
−1
z
2 p 1/2
851.10 + 2.08C
−1
z
2 p 3/2
eV
0.51 + 4.99C
−1
z
3d 5/2
6.7 Li, Na, K, Rb, and Cs Clusters and Skins
6.7.1 Na 2p and K 3p Entrapment
Figure 6.17 and Table 6.5 feature the decomposition of the 2p profiles for Na N
[92] and the 3p for K N [93] atomic clusters. Table 6.6 lists the DFT derived charge
transportation and bond strain for atoms located at different positions of I h -13 and
I h -55 structures. Results indicate that the skin of lower coordinated atoms gain charge
from the inner atoms because of the skin quantum entrapment. Bonds between lower
coordinated corner or edge atoms contract more than that in the cluster interior [84].
6.7.2 CN Dependent Binding Energy Shift
Figure 6.18 shows the DFT derivatives of atomic-site resolved 2p shift for Na 13
and Na 55 clusters. Clearly, the fewer the neighbors is, the more the CLS will be.
The size trend of the K 3p CLS is the same and it is unnecessary to repeat. This
observation elaborates sufficiently the size trends for the Na 2p and the K 3p CLS.
Table 6.6 features the local strain, charge gain, and the CLS for atoms at different
sites in the Na 13 and in the Na 55 clusters. Consistency between measurements and
DFT calculations confirms the BOLS Prediction.
121
Table 6.4 BOLS-TBAPECS derived information
of E M , E L and E k energy
shift for Ni/TiO 2 films [82]
Ni (m = 1, τ = 1)
E ν (0)/eV
E ν (∞)/eV
E ν (∞)/eV
2p 1/2
868.23
870.33
2.10
2p 3/2
851.10
853.18
2.08
3d 5/2
0.51
5.49
4.99
E K (LMM)
853.02
845.45
−7.57
η ML = 4.99/2.08 = 2.40 indicates that the crystal field experienced
by the 3d electrons is 2.4 times that of the 2p electrons. The κ ML ~
1 in Fig. 6.16c shows that the Ni/TiO 2 interface effect is negligible
The CN dependent L 1 , L 3 , and the M 5 shift:
E ν (z) = E ν (0) + E ν (12)C
−1
z
=
⎧
⎨
⎩
868.23 + 2.10C
−1
z
2 p 1/2
851.10 + 2.08C
−1
z
2 p 3/2
eV
0.51 + 4.99C
−1
z
3d 5/2
6.7 Li, Na, K, Rb, and Cs Clusters and Skins
6.7.1 Na 2p and K 3p Entrapment
Figure 6.17 and Table 6.5 feature the decomposition of the 2p profiles for Na N
[92] and the 3p for K N [93] atomic clusters. Table 6.6 lists the DFT derived charge
transportation and bond strain for atoms located at different positions of I h -13 and
I h -55 structures. Results indicate that the skin of lower coordinated atoms gain charge
from the inner atoms because of the skin quantum entrapment. Bonds between lower
coordinated corner or edge atoms contract more than that in the cluster interior [84].
6.7.2 CN Dependent Binding Energy Shift
Figure 6.18 shows the DFT derivatives of atomic-site resolved 2p shift for Na 13
and Na 55 clusters. Clearly, the fewer the neighbors is, the more the CLS will be.
The size trend of the K 3p CLS is the same and it is unnecessary to repeat. This
observation elaborates sufficiently the size trends for the Na 2p and the K 3p CLS.
Table 6.6 features the local strain, charge gain, and the CLS for atoms at different
sites in the Na 13 and in the Na 55 clusters. Consistency between measurements and
DFT calculations confirms the BOLS Prediction.