

114
6 Atomic Chains, Clusters, and Nanocrystals
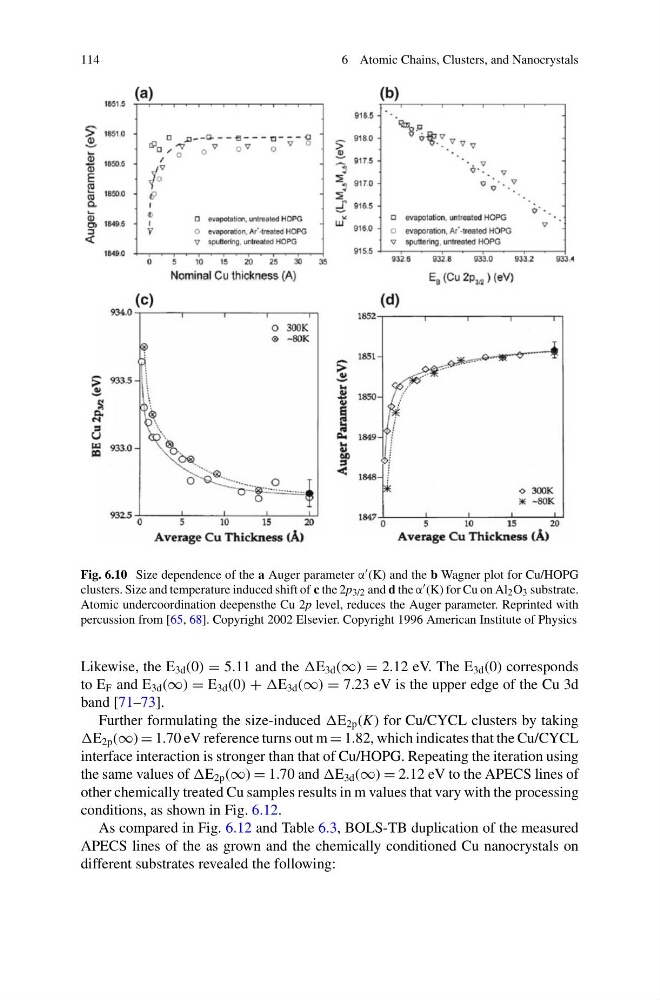
Fig. 6.10 Size dependence of the a Auger parameter α (K) and the b Wagner plot for Cu/HOPG
clusters. Size and temperature induced shift of c the 2p 3/2 and d the α (K) for Cu on Al 2 O 3 substrate.
Atomic undercoordination deepensthe Cu 2p level, reduces the Auger parameter. Reprinted with
percussion from [65, 68]. Copyright 2002 Elsevier. Copyright 1996 American Institute of Physics
Likewise, the E 3d (0) = 5.11 and the E 3d (∞) = 2.12 eV. The E 3d (0) corresponds
to E F and E 3d (∞) = E 3d (0) + E 3d (∞) = 7.23 eV is the upper edge of the Cu 3d
band [71–73].
Further formulating the size-induced E 2p (K) for Cu/CYCL clusters by taking
E 2p (∞) = 1.70 eV reference turns out m = 1.82, which indicates that the Cu/CYCL
interface interaction is stronger than that of Cu/HOPG. Repeating the iteration using
the same values of E 2p (∞) = 1.70 and E 3d (∞) = 2.12 eV to the APECS lines of
other chemically treated Cu samples results in m values that vary with the processing
conditions, as shown in Fig. 6.12.
As compared in Fig. 6.12 and Table 6.3, BOLS-TB duplication of the measured
APECS lines of the as grown and the chemically conditioned Cu nanocrystals on
different substrates revealed the following:
6 Atomic Chains, Clusters, and Nanocrystals
Fig. 6.10 Size dependence of the a Auger parameter α (K) and the b Wagner plot for Cu/HOPG
clusters. Size and temperature induced shift of c the 2p 3/2 and d the α (K) for Cu on Al 2 O 3 substrate.
Atomic undercoordination deepensthe Cu 2p level, reduces the Auger parameter. Reprinted with
percussion from [65, 68]. Copyright 2002 Elsevier. Copyright 1996 American Institute of Physics
Likewise, the E 3d (0) = 5.11 and the E 3d (∞) = 2.12 eV. The E 3d (0) corresponds
to E F and E 3d (∞) = E 3d (0) + E 3d (∞) = 7.23 eV is the upper edge of the Cu 3d
band [71–73].
Further formulating the size-induced E 2p (K) for Cu/CYCL clusters by taking
E 2p (∞) = 1.70 eV reference turns out m = 1.82, which indicates that the Cu/CYCL
interface interaction is stronger than that of Cu/HOPG. Repeating the iteration using
the same values of E 2p (∞) = 1.70 and E 3d (∞) = 2.12 eV to the APECS lines of
other chemically treated Cu samples results in m values that vary with the processing
conditions, as shown in Fig. 6.12.
As compared in Fig. 6.12 and Table 6.3, BOLS-TB duplication of the measured
APECS lines of the as grown and the chemically conditioned Cu nanocrystals on
different substrates revealed the following: