

19 Evaluation and Optimization of the Treatment Scheme …
205
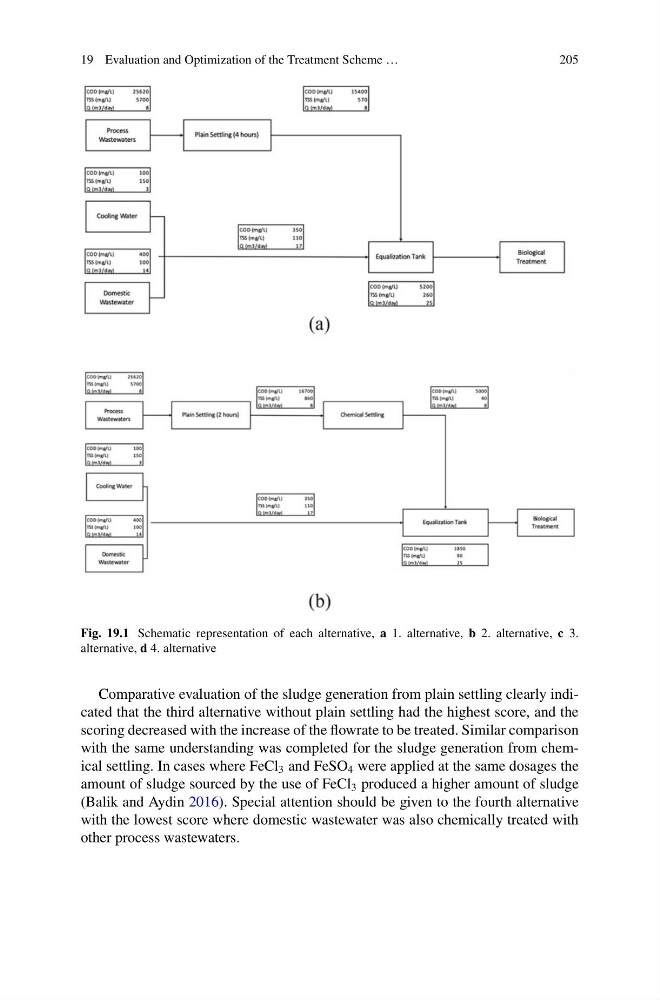
Fig. 19.1 Schematic representation of each alternative, a 1. alternative, b 2. alternative, c 3.
alternative, d 4. alternative
Comparative evaluation of the sludge generation from plain settling clearly indicated that the third alternative without plain settling had the highest score, and the
scoring decreased with the increase of the flowrate to be treated. Similar comparison
with the same understanding was completed for the sludge generation from chemical settling. In cases where FeCl 3 and FeSO 4 were applied at the same dosages the
amount of sludge sourced by the use of FeCl 3 produced a higher amount of sludge
(Balik and Aydin 2016). Special attention should be given to the fourth alternative
with the lowest score where domestic wastewater was also chemically treated with
other process wastewaters.
205
Fig. 19.1 Schematic representation of each alternative, a 1. alternative, b 2. alternative, c 3.
alternative, d 4. alternative
Comparative evaluation of the sludge generation from plain settling clearly indicated that the third alternative without plain settling had the highest score, and the
scoring decreased with the increase of the flowrate to be treated. Similar comparison
with the same understanding was completed for the sludge generation from chemical settling. In cases where FeCl 3 and FeSO 4 were applied at the same dosages the
amount of sludge sourced by the use of FeCl 3 produced a higher amount of sludge
(Balik and Aydin 2016). Special attention should be given to the fourth alternative
with the lowest score where domestic wastewater was also chemically treated with
other process wastewaters.