

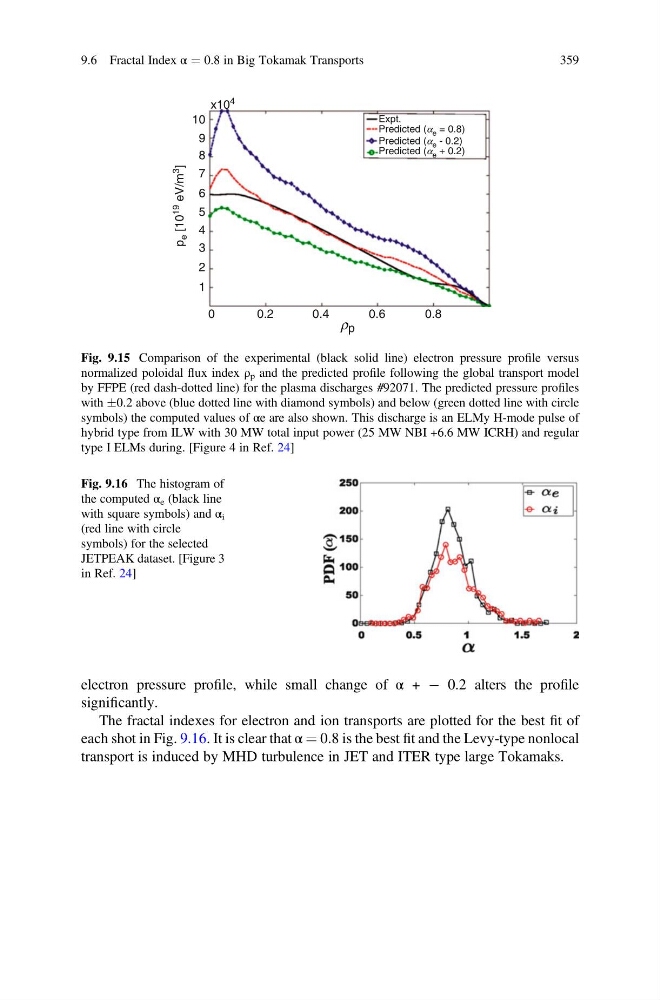
electron pressure profile, while small change of α + À 0.2 alters the profile
significantly.
The fractal indexes for electron and ion transports are plotted for the best fit of
each shot in Fig. 9.16. It is clear that α ¼ 0.8 is the best fit and the Levy-type nonlocal
transport is induced by MHD turbulence in JET and ITER type large Tokamaks.
10
9
8
7
p
e [10
19
eV/m
3
]
6
5
4
3
2
1
0
0.2
0.4 r p
0.6
Expt.
Predicted (a e = 0.8)
Predicted (a e - 0.2)
Predicted (a e + 0.2)
x10
4
0.8
Fig. 9.15 Comparison of the experimental (black solid line) electron pressure profile versus
normalized poloidal flux index ρ p and the predicted profile following the global transport model
by FFPE (red dash-dotted line) for the plasma discharges #92071. The predicted pressure profiles
with Æ0.2 above (blue dotted line with diamond symbols) and below (green dotted line with circle
symbols) the computed values of αe are also shown. This discharge is an ELMy H-mode pulse of
hybrid type from ILW with 30 MW total input power (25 MW NBI +6.6 MW ICRH) and regular
type I ELMs during. [Figure 4 in Ref. 24]
Fig. 9.16 The histogram of
the computed α e (black line
with square symbols) and α i
(red line with circle
symbols) for the selected
JETPEAK dataset. [Figure 3
in Ref. 24]
9.6 Fractal Index α ¼ 0.8 in Big Tokamak Transports
359
significantly.
The fractal indexes for electron and ion transports are plotted for the best fit of
each shot in Fig. 9.16. It is clear that α ¼ 0.8 is the best fit and the Levy-type nonlocal
transport is induced by MHD turbulence in JET and ITER type large Tokamaks.
10
9
8
7
p
e [10
19
eV/m
3
]
6
5
4
3
2
1
0
0.2
0.4 r p
0.6
Expt.
Predicted (a e = 0.8)
Predicted (a e - 0.2)
Predicted (a e + 0.2)
x10
4
0.8
Fig. 9.15 Comparison of the experimental (black solid line) electron pressure profile versus
normalized poloidal flux index ρ p and the predicted profile following the global transport model
by FFPE (red dash-dotted line) for the plasma discharges #92071. The predicted pressure profiles
with Æ0.2 above (blue dotted line with diamond symbols) and below (green dotted line with circle
symbols) the computed values of αe are also shown. This discharge is an ELMy H-mode pulse of
hybrid type from ILW with 30 MW total input power (25 MW NBI +6.6 MW ICRH) and regular
type I ELMs during. [Figure 4 in Ref. 24]
Fig. 9.16 The histogram of
the computed α e (black line
with square symbols) and α i
(red line with circle
symbols) for the selected
JETPEAK dataset. [Figure 3
in Ref. 24]
9.6 Fractal Index α ¼ 0.8 in Big Tokamak Transports
359