

f
L p, t
ð Þ ¼
1
πDt
1
1 þ p=Dt
ð
Þ
2
ð9:4:6Þ
Note that the solution in the limit q equal to 1 becomes a Gaussian distribution
same as the analytical solution of (9.4.2) for α ¼ 2 as plotted by black in Fig. 9.6. In
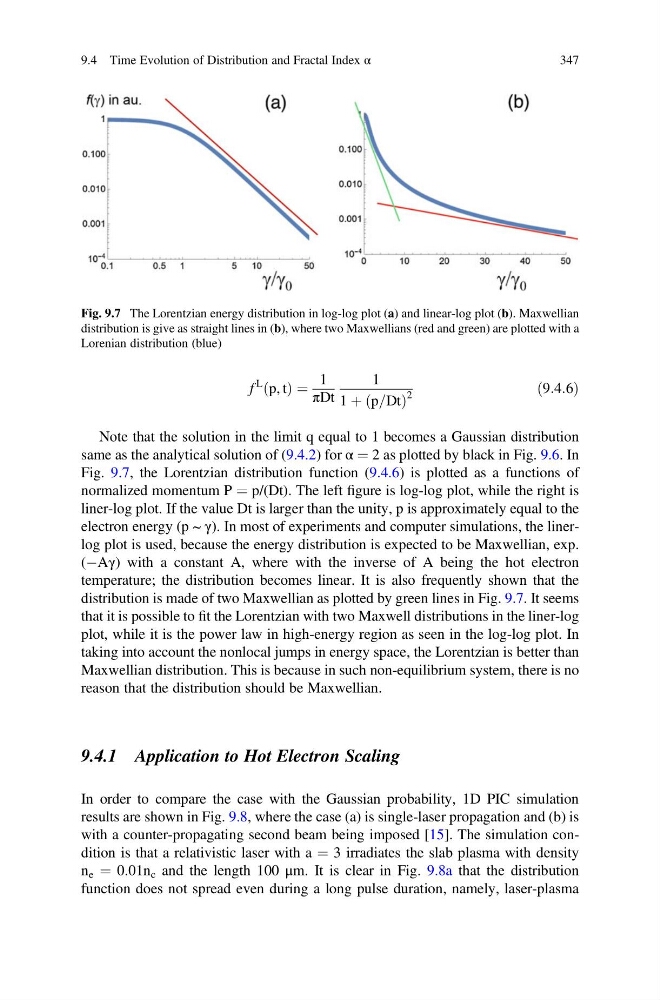
Fig. 9.7, the Lorentzian distribution function (9.4.6) is plotted as a functions of
normalized momentum P ¼ p/(Dt). The left figure is log-log plot, while the right is
liner-log plot. If the value Dt is larger than the unity, p is approximately equal to the
electron energy (p ~ γ). In most of experiments and computer simulations, the linerlog plot is used, because the energy distribution is expected to be Maxwellian, exp.
(ÀAγ) with a constant A, where with the inverse of A being the hot electron
temperature; the distribution becomes linear. It is also frequently shown that the
distribution is made of two Maxwellian as plotted by green lines in Fig. 9.7. It seems
that it is possible to fit the Lorentzian with two Maxwell distributions in the liner-log
plot, while it is the power law in high-energy region as seen in the log-log plot. In
taking into account the nonlocal jumps in energy space, the Lorentzian is better than
Maxwellian distribution. This is because in such non-equilibrium system, there is no
reason that the distribution should be Maxwellian.
9.4.1 Application to Hot Electron Scaling
In order to compare the case with the Gaussian probability, 1D PIC simulation
results are shown in Fig. 9.8, where the case (a) is single-laser propagation and (b) is
with a counter-propagating second beam being imposed [15]. The simulation condition is that a relativistic laser with a ¼ 3 irradiates the slab plasma with density
n e ¼ 0.01n c and the length 100 μm. It is clear in Fig. 9.8a that the distribution
function does not spread even during a long pulse duration, namely, laser-plasma
Fig. 9.7 The Lorentzian energy distribution in log-log plot (a) and linear-log plot (b). Maxwellian
distribution is give as straight lines in (b), where two Maxwellians (red and green) are plotted with a
Lorenian distribution (blue)
9.4 Time Evolution of Distribution and Fractal Index α
347
L p, t
ð Þ ¼
1
πDt
1
1 þ p=Dt
ð
Þ
2
ð9:4:6Þ
Note that the solution in the limit q equal to 1 becomes a Gaussian distribution
same as the analytical solution of (9.4.2) for α ¼ 2 as plotted by black in Fig. 9.6. In
Fig. 9.7, the Lorentzian distribution function (9.4.6) is plotted as a functions of
normalized momentum P ¼ p/(Dt). The left figure is log-log plot, while the right is
liner-log plot. If the value Dt is larger than the unity, p is approximately equal to the
electron energy (p ~ γ). In most of experiments and computer simulations, the linerlog plot is used, because the energy distribution is expected to be Maxwellian, exp.
(ÀAγ) with a constant A, where with the inverse of A being the hot electron
temperature; the distribution becomes linear. It is also frequently shown that the
distribution is made of two Maxwellian as plotted by green lines in Fig. 9.7. It seems
that it is possible to fit the Lorentzian with two Maxwell distributions in the liner-log
plot, while it is the power law in high-energy region as seen in the log-log plot. In
taking into account the nonlocal jumps in energy space, the Lorentzian is better than
Maxwellian distribution. This is because in such non-equilibrium system, there is no
reason that the distribution should be Maxwellian.
9.4.1 Application to Hot Electron Scaling
In order to compare the case with the Gaussian probability, 1D PIC simulation
results are shown in Fig. 9.8, where the case (a) is single-laser propagation and (b) is
with a counter-propagating second beam being imposed [15]. The simulation condition is that a relativistic laser with a ¼ 3 irradiates the slab plasma with density
n e ¼ 0.01n c and the length 100 μm. It is clear in Fig. 9.8a that the distribution
function does not spread even during a long pulse duration, namely, laser-plasma
Fig. 9.7 The Lorentzian energy distribution in log-log plot (a) and linear-log plot (b). Maxwellian
distribution is give as straight lines in (b), where two Maxwellians (red and green) are plotted with a
Lorenian distribution (blue)
9.4 Time Evolution of Distribution and Fractal Index α
347