

p p 0 þ δp 0
ð
ÞÀp p 0
ð Þ
j
j ¼ δp 0
j jexp λt
ð Þ
ð8:7:10Þ
So, if the Lyapunov exponent λ is positive, the physical positions of the points
initially very near to each other go to very far distant points in the phase space. Such
case is defined to be chaos.
In Fig. 8.30a, the time evolution of the Lyapunov exponent is plotted for three
different amplitudes a 1 of perturbation beam for a given incident laser a 0 ¼ 1.5,
where the definition of (a 1 , a 2 ) ¼ (a 0 , a 1 ) in the present text. It is clear that for a 2
larger than 0.3, the distance between two particles is going apart exponentially as
green line because of stochastic motion of particles. The criteria diagram shown in
Fig. 8.26 is compared to such computational results in Fig. 8.30b. The criteria in
Fig. 8.26 is plotted with the solid lines, while the PIC result is shown with marks.
The result is approximately expressed as [22]
a 0 a 1 > 0:5
ð8:7:11Þ
It is clear that Mendonca’s theoretical evaluation based on Chrikov-overlap criteria
is lower than the PIC simulation result. This is because (8.7.1) is derived by linear
approximation applicable to the region a 2 < < a 1 in Fig. 8.30b.
Realistic simulation has been done with 2D PIC code to demonstrate better
coupling of laser with the solid plasma by use of corrugated solid target [24]. The
time evolution of electron distribution in phase space is plotted for a smooth surface
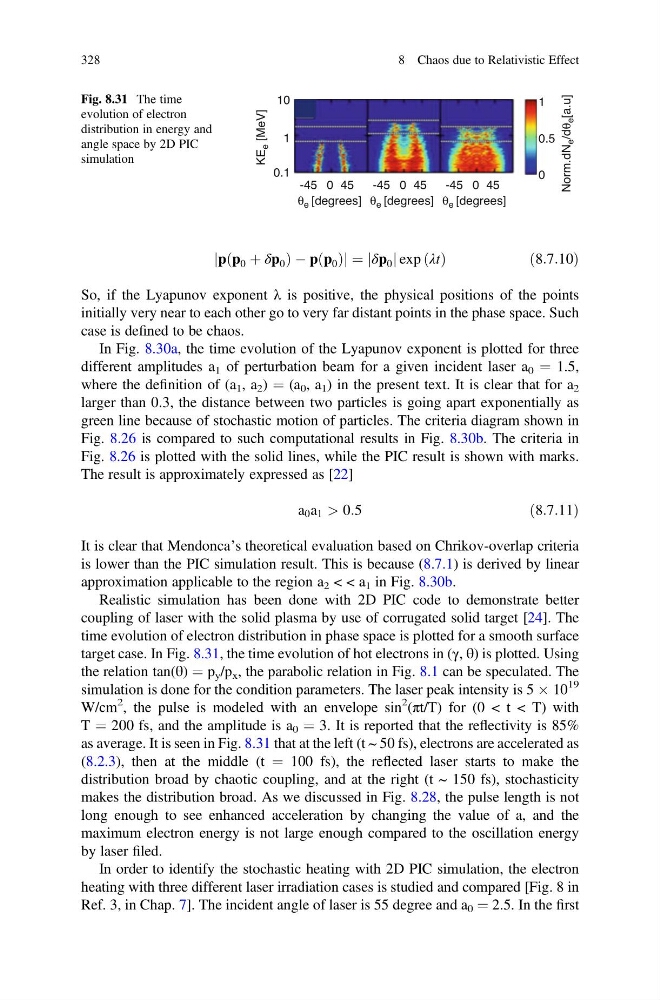
target case. In Fig. 8.31, the time evolution of hot electrons in (γ, θ) is plotted. Using
the relation tan(θ) ¼ p y /p x , the parabolic relation in Fig. 8.1 can be speculated. The
simulation is done for the condition parameters. The laser peak intensity is 5 Â 10
19
W/cm
2
, the pulse is modeled with an envelope sin
2 (πt/T) for (0 < t < T) with
T ¼ 200 fs, and the amplitude is a 0 ¼ 3. It is reported that the reflectivity is 85%
as average. It is seen in Fig. 8.31 that at the left (t ~ 50 fs), electrons are accelerated as
(8.2.3), then at the middle (t ¼ 100 fs), the reflected laser starts to make the
distribution broad by chaotic coupling, and at the right (t ~ 150 fs), stochasticity
makes the distribution broad. As we discussed in Fig. 8.28, the pulse length is not
long enough to see enhanced acceleration by changing the value of a, and the
maximum electron energy is not large enough compared to the oscillation energy
by laser filed.
In order to identify the stochastic heating with 2D PIC simulation, the electron
heating with three different laser irradiation cases is studied and compared [Fig. 8 in
Ref. 3, in Chap. 7]. The incident angle of laser is 55 degree and a 0 ¼ 2.5. In the first
10
1
0.1
KE
e [MeV]
-45
θ e [degrees] θ e [degrees] θ e [degrees]
Norm.dN
e /dθ
e [a.u]
0
0
1
0.5
45
-45 0 45
-45 0 45
Fig. 8.31 The time
evolution of electron
distribution in energy and
angle space by 2D PIC
simulation
328
8 Chaos due to Relativistic Effect
ð
ÞÀp p 0
ð Þ
j
j ¼ δp 0
j jexp λt
ð Þ
ð8:7:10Þ
So, if the Lyapunov exponent λ is positive, the physical positions of the points
initially very near to each other go to very far distant points in the phase space. Such
case is defined to be chaos.
In Fig. 8.30a, the time evolution of the Lyapunov exponent is plotted for three
different amplitudes a 1 of perturbation beam for a given incident laser a 0 ¼ 1.5,
where the definition of (a 1 , a 2 ) ¼ (a 0 , a 1 ) in the present text. It is clear that for a 2
larger than 0.3, the distance between two particles is going apart exponentially as
green line because of stochastic motion of particles. The criteria diagram shown in
Fig. 8.26 is compared to such computational results in Fig. 8.30b. The criteria in
Fig. 8.26 is plotted with the solid lines, while the PIC result is shown with marks.
The result is approximately expressed as [22]
a 0 a 1 > 0:5
ð8:7:11Þ
It is clear that Mendonca’s theoretical evaluation based on Chrikov-overlap criteria
is lower than the PIC simulation result. This is because (8.7.1) is derived by linear
approximation applicable to the region a 2 < < a 1 in Fig. 8.30b.
Realistic simulation has been done with 2D PIC code to demonstrate better
coupling of laser with the solid plasma by use of corrugated solid target [24]. The
time evolution of electron distribution in phase space is plotted for a smooth surface
target case. In Fig. 8.31, the time evolution of hot electrons in (γ, θ) is plotted. Using
the relation tan(θ) ¼ p y /p x , the parabolic relation in Fig. 8.1 can be speculated. The
simulation is done for the condition parameters. The laser peak intensity is 5 Â 10
19
W/cm
2
, the pulse is modeled with an envelope sin
2 (πt/T) for (0 < t < T) with
T ¼ 200 fs, and the amplitude is a 0 ¼ 3. It is reported that the reflectivity is 85%
as average. It is seen in Fig. 8.31 that at the left (t ~ 50 fs), electrons are accelerated as
(8.2.3), then at the middle (t ¼ 100 fs), the reflected laser starts to make the
distribution broad by chaotic coupling, and at the right (t ~ 150 fs), stochasticity
makes the distribution broad. As we discussed in Fig. 8.28, the pulse length is not
long enough to see enhanced acceleration by changing the value of a, and the
maximum electron energy is not large enough compared to the oscillation energy
by laser filed.
In order to identify the stochastic heating with 2D PIC simulation, the electron
heating with three different laser irradiation cases is studied and compared [Fig. 8 in
Ref. 3, in Chap. 7]. The incident angle of laser is 55 degree and a 0 ¼ 2.5. In the first
10
1
0.1
KE
e [MeV]
-45
θ e [degrees] θ e [degrees] θ e [degrees]
Norm.dN
e /dθ
e [a.u]
0
0
1
0.5
45
-45 0 45
-45 0 45
Fig. 8.31 The time
evolution of electron
distribution in energy and
angle space by 2D PIC
simulation
328
8 Chaos due to Relativistic Effect