

the case a 1 ¼ 0. The blue dots are taken from the electron trajectory till the
normalized time 100 (~52 fs). It is seen that the blue dots start from (ξ, γ) ¼ (0, 1)
at t ¼ 0, take a path in the first increase like the lines in Fig. 8.2, and come to the time
limit near the top of the second mountain. The time is too short for the orbit to be
chaotic.
Then, the red dots are the points until the time t ¼ 1000 (~520 fs). It is seen that
the maximum energy increased more than 50 predicted by (8.2.3) and the orbit with
the energy γ less than ~30 becomes chaotic. Thanks to the chaotic change of the
adiabatic constant α less than unity, the red dot trajectory seems to take trajectory
given in (8.1.22) in later time.
The green dots are taken from the trajectory until the time 10,000 (~5.2 ps). The
property does not change from the case of the red dots, while the maximum energy
approached to γ ¼ 150. In the green dots, the trajectory below the region with about
the maximum γ ¼ 30 becomes highly chaotic, and they take the relation (8.1.22)
with different α values. As we see soon, the value α changes easily at the time when
electrons stop moving with γ ¼ 1.
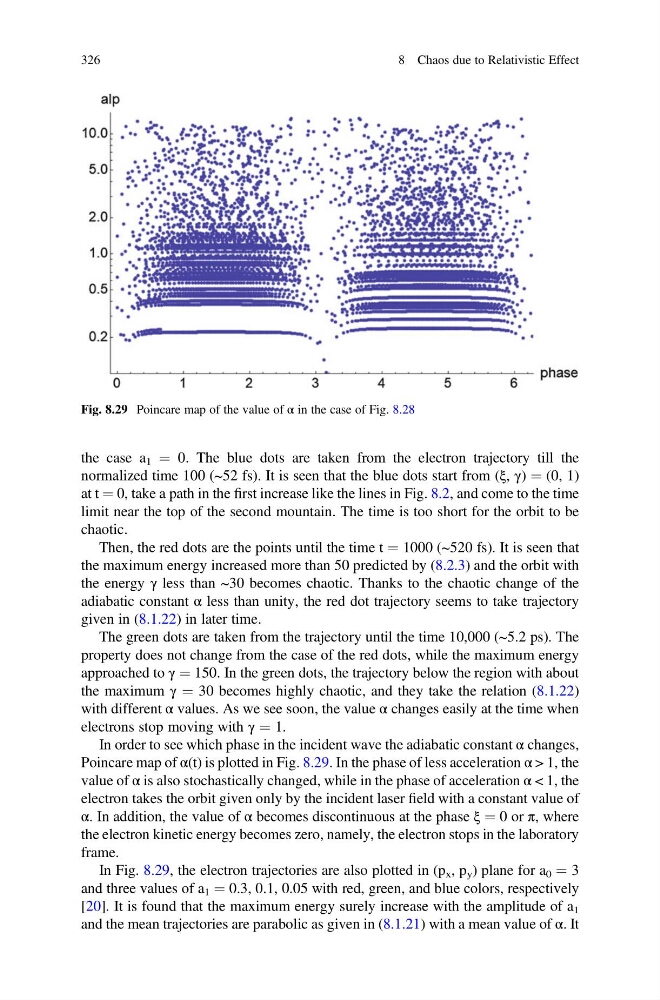
In order to see which phase in the incident wave the adiabatic constant α changes,
Poincare map of α(t) is plotted in Fig. 8.29. In the phase of less acceleration α > 1, the
value of α is also stochastically changed, while in the phase of acceleration α < 1, the
electron takes the orbit given only by the incident laser field with a constant value of
α. In addition, the value of α becomes discontinuous at the phase ξ ¼ 0 or π, where
the electron kinetic energy becomes zero, namely, the electron stops in the laboratory
frame.
In Fig. 8.29, the electron trajectories are also plotted in (p x , p y ) plane for a 0 ¼ 3
and three values of a 1 ¼ 0.3, 0.1, 0.05 with red, green, and blue colors, respectively
[20]. It is found that the maximum energy surely increase with the amplitude of a 1
and the mean trajectories are parabolic as given in (8.1.21) with a mean value of α. It
Fig. 8.29 Poincare map of the value of α in the case of Fig. 8.28
326
8 Chaos due to Relativistic Effect
normalized time 100 (~52 fs). It is seen that the blue dots start from (ξ, γ) ¼ (0, 1)
at t ¼ 0, take a path in the first increase like the lines in Fig. 8.2, and come to the time
limit near the top of the second mountain. The time is too short for the orbit to be
chaotic.
Then, the red dots are the points until the time t ¼ 1000 (~520 fs). It is seen that
the maximum energy increased more than 50 predicted by (8.2.3) and the orbit with
the energy γ less than ~30 becomes chaotic. Thanks to the chaotic change of the
adiabatic constant α less than unity, the red dot trajectory seems to take trajectory
given in (8.1.22) in later time.
The green dots are taken from the trajectory until the time 10,000 (~5.2 ps). The
property does not change from the case of the red dots, while the maximum energy
approached to γ ¼ 150. In the green dots, the trajectory below the region with about
the maximum γ ¼ 30 becomes highly chaotic, and they take the relation (8.1.22)
with different α values. As we see soon, the value α changes easily at the time when
electrons stop moving with γ ¼ 1.
In order to see which phase in the incident wave the adiabatic constant α changes,
Poincare map of α(t) is plotted in Fig. 8.29. In the phase of less acceleration α > 1, the
value of α is also stochastically changed, while in the phase of acceleration α < 1, the
electron takes the orbit given only by the incident laser field with a constant value of
α. In addition, the value of α becomes discontinuous at the phase ξ ¼ 0 or π, where
the electron kinetic energy becomes zero, namely, the electron stops in the laboratory
frame.
In Fig. 8.29, the electron trajectories are also plotted in (p x , p y ) plane for a 0 ¼ 3
and three values of a 1 ¼ 0.3, 0.1, 0.05 with red, green, and blue colors, respectively
[20]. It is found that the maximum energy surely increase with the amplitude of a 1
and the mean trajectories are parabolic as given in (8.1.21) with a mean value of α. It
Fig. 8.29 Poincare map of the value of α in the case of Fig. 8.28
326
8 Chaos due to Relativistic Effect