

of Fig. 8.17. In comparing theory and experiment, electron escape should be
modeled in the laser beam region in the low-density plasmas.
8.6.2 Hot Electrons by Picosecond Lasers
There are only a limited number of big laser facilities which can deliver such
relativistic lasers with pulse duration longer than ps. It is well-known that the
hot electron temperature increases in general with the increase of the pulse
duration. For example, the effective temperature increases in proportion to t
1/3 . By
use of an electron spectrometer, time-integrated electron energy distribution has
been measured.
LFEX laser has been used to measure the hot electron production as a function of
pulse length by combining four pulses with 1.5 ps pulse width each [11]. The timeintegrated hot electron temperature is reported to increase from 1.5 ps to 3 ps pulses,
while it almost saturates around 3 ps and is observed the same for 6 ps as 3 ps pulse.
The laser intensity is kept 2.3 Â 10
18 W/cm
2 for λ ¼ 1 μm. The time evolution of the
hot electron temperature is simulated by PIC code as shown in Fig. 8.22. It is found
that the time-integrated hot electron temperature well explains the experimental data.
After the above experiment with LFEX, the precise measurement of timeintegrated electron energy spectra has been carried out [12]. Gold cube targets are
irradiated by LFEX laser with two different pulse lengths and two different laser
intensities. The case of 1.2 ps pulse with laser intensity of 2.5 Â 10
18 W/cm
2 is
compared to the other two cases. It is reported that with increase of laser intensity
four times to 1.0 Â 10
19 W/cm
2 or the pulse duration about four times longer (4 ps),
the almost the same energy distribution is obtained in both. It roughly indicates that
the spread of the distribution function is a function of a 0
2
τ L . It is surprising that
Maxwell distributions are well fit to both cases and the corresponding 2D PIC
10
8
10
7
dN/dE
[num. of elecrons/(sr keV shot)]
10
6
-540 PS
-410 PS
-270 PS
-140 PS
-73 PS
-67 PS
60 PS
wo CP A2
130 PS
0
500
energy [keV]
0.6
0.4
0.2
0
-600
2 7 0 k e V
-300
0
delay [ps]
energy [mJ/sr]
1000
1500
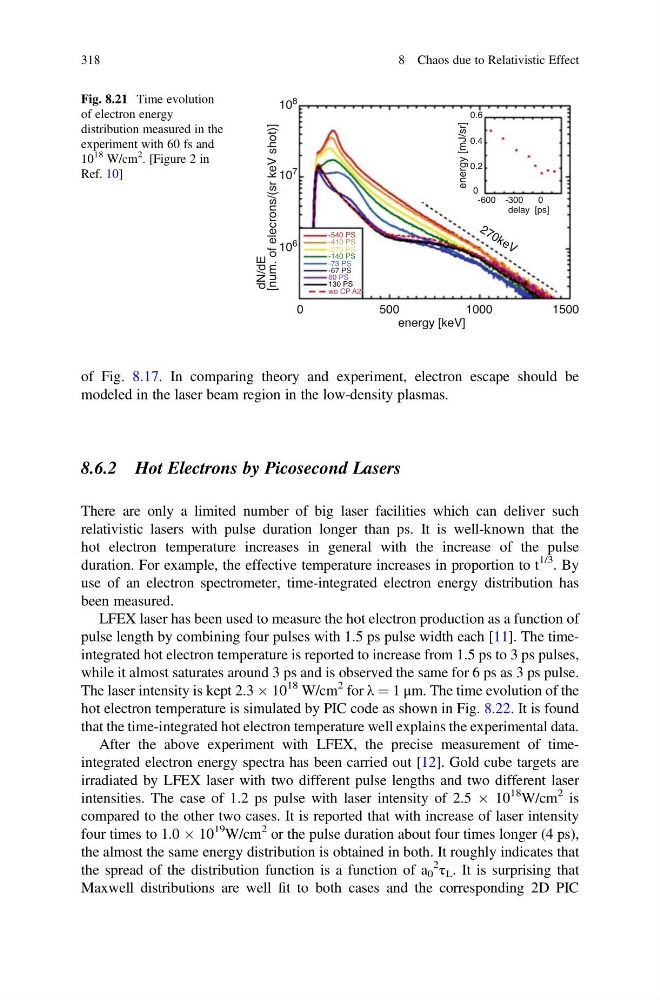
Fig. 8.21 Time evolution
of electron energy
distribution measured in the
experiment with 60 fs and
10
18 W/cm
2
. [Figure 2 in
Ref. 10]
318
8 Chaos due to Relativistic Effect
modeled in the laser beam region in the low-density plasmas.
8.6.2 Hot Electrons by Picosecond Lasers
There are only a limited number of big laser facilities which can deliver such
relativistic lasers with pulse duration longer than ps. It is well-known that the
hot electron temperature increases in general with the increase of the pulse
duration. For example, the effective temperature increases in proportion to t
1/3 . By
use of an electron spectrometer, time-integrated electron energy distribution has
been measured.
LFEX laser has been used to measure the hot electron production as a function of
pulse length by combining four pulses with 1.5 ps pulse width each [11]. The timeintegrated hot electron temperature is reported to increase from 1.5 ps to 3 ps pulses,
while it almost saturates around 3 ps and is observed the same for 6 ps as 3 ps pulse.
The laser intensity is kept 2.3 Â 10
18 W/cm
2 for λ ¼ 1 μm. The time evolution of the
hot electron temperature is simulated by PIC code as shown in Fig. 8.22. It is found
that the time-integrated hot electron temperature well explains the experimental data.
After the above experiment with LFEX, the precise measurement of timeintegrated electron energy spectra has been carried out [12]. Gold cube targets are
irradiated by LFEX laser with two different pulse lengths and two different laser
intensities. The case of 1.2 ps pulse with laser intensity of 2.5 Â 10
18 W/cm
2 is
compared to the other two cases. It is reported that with increase of laser intensity
four times to 1.0 Â 10
19 W/cm
2 or the pulse duration about four times longer (4 ps),
the almost the same energy distribution is obtained in both. It roughly indicates that
the spread of the distribution function is a function of a 0
2
τ L . It is surprising that
Maxwell distributions are well fit to both cases and the corresponding 2D PIC
10
8
10
7
dN/dE
[num. of elecrons/(sr keV shot)]
10
6
-540 PS
-410 PS
-270 PS
-140 PS
-73 PS
-67 PS
60 PS
wo CP A2
130 PS
0
500
energy [keV]
0.6
0.4
0.2
0
-600
2 7 0 k e V
-300
0
delay [ps]
energy [mJ/sr]
1000
1500
Fig. 8.21 Time evolution
of electron energy
distribution measured in the
experiment with 60 fs and
10
18 W/cm
2
. [Figure 2 in
Ref. 10]
318
8 Chaos due to Relativistic Effect