

A λ ¼ 1 μm Gaussian laser of 175 fs and about 9 μm intensity width in y-direction
is irradiated to the plasma at the intensity of 6 Â 10
20 W/cm
2 , corresponding to
a 0 ¼ 7.2 (a 0
2
¼ 52). Note that this intensity is the case of a 0 > > 1 as mentioned
above. The plasma is a solid target and the pre-formed plasma with its scale length
3 μm. The plasma length with the density less than the critical density is about
20 μm. The aluminum plasma is assumed partially ionized with the charge of +3, and
the statistical ionization process via the over-threshold ionization is modeled in the
PIC code. Two types of the generation of super-ponderomotive hot electrons are
found in [2]. The super-ponderomotive hot electron means electrons with the
kinetic energy much larger than the ponderomotive scaling temperature defined in
(3.16.4), which is about T h ~ 5 MeV for a 0 ¼ 7.2.
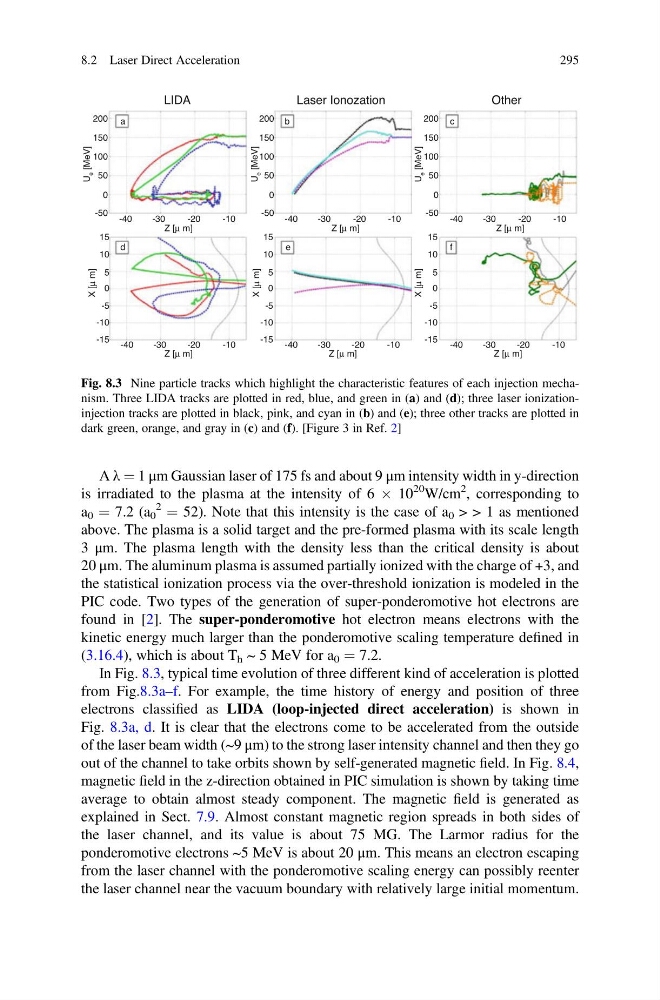
In Fig. 8.3, typical time evolution of three different kind of acceleration is plotted
from Fig.8.3a–f. For example, the time history of energy and position of three
electrons classified as LIDA (loop-injected direct acceleration) is shown in
Fig. 8.3a, d. It is clear that the electrons come to be accelerated from the outside
of the laser beam width (~9 μm) to the strong laser intensity channel and then they go
out of the channel to take orbits shown by self-generated magnetic field. In Fig. 8.4,
magnetic field in the z-direction obtained in PIC simulation is shown by taking time
average to obtain almost steady component. The magnetic field is generated as
explained in Sect. 7.9. Almost constant magnetic region spreads in both sides of
the laser channel, and its value is about 75 MG. The Larmor radius for the
ponderomotive electrons ~5 MeV is about 20 μm. This means an electron escaping
from the laser channel with the ponderomotive scaling energy can possibly reenter
the laser channel near the vacuum boundary with relatively large initial momentum.
200
LIDA
Laser Ionozation
Other
150
100
-40
15
10
5
0
-5
-10
-15
15
10
5
0
-5
-10
-15
15
10
5
0
-5
-10
-15
-40
-30
-20
-10
U
e
[MeV]
U
e [MeV]
U
e
[MeV]
-30
-20
-10
-40
-30
-20
-10
-40
-30
-20
-10
50
Z [μ m]
Z [μ m]
-40
-30
-20
-10
Z [μ m]
-40
-30
-20
-10
Z [μ m]
X [μ m]
X [μ m]
X [μ m]
Z [μ m]
Z [μ m]
0
a
d
e
f
b
c
-50
200
150
100
50
0
-50
200
150
100
50
0
-50
Fig. 8.3 Nine particle tracks which highlight the characteristic features of each injection mechanism. Three LIDA tracks are plotted in red, blue, and green in (a) and (d); three laser ionizationinjection tracks are plotted in black, pink, and cyan in (b) and (e); three other tracks are plotted in
dark green, orange, and gray in (c) and (f). [Figure 3 in Ref. 2]
8.2 Laser Direct Acceleration
295
is irradiated to the plasma at the intensity of 6 Â 10
20 W/cm
2 , corresponding to
a 0 ¼ 7.2 (a 0
2
¼ 52). Note that this intensity is the case of a 0 > > 1 as mentioned
above. The plasma is a solid target and the pre-formed plasma with its scale length
3 μm. The plasma length with the density less than the critical density is about
20 μm. The aluminum plasma is assumed partially ionized with the charge of +3, and
the statistical ionization process via the over-threshold ionization is modeled in the
PIC code. Two types of the generation of super-ponderomotive hot electrons are
found in [2]. The super-ponderomotive hot electron means electrons with the
kinetic energy much larger than the ponderomotive scaling temperature defined in
(3.16.4), which is about T h ~ 5 MeV for a 0 ¼ 7.2.
In Fig. 8.3, typical time evolution of three different kind of acceleration is plotted
from Fig.8.3a–f. For example, the time history of energy and position of three
electrons classified as LIDA (loop-injected direct acceleration) is shown in
Fig. 8.3a, d. It is clear that the electrons come to be accelerated from the outside
of the laser beam width (~9 μm) to the strong laser intensity channel and then they go
out of the channel to take orbits shown by self-generated magnetic field. In Fig. 8.4,
magnetic field in the z-direction obtained in PIC simulation is shown by taking time
average to obtain almost steady component. The magnetic field is generated as
explained in Sect. 7.9. Almost constant magnetic region spreads in both sides of
the laser channel, and its value is about 75 MG. The Larmor radius for the
ponderomotive electrons ~5 MeV is about 20 μm. This means an electron escaping
from the laser channel with the ponderomotive scaling energy can possibly reenter
the laser channel near the vacuum boundary with relatively large initial momentum.
200
LIDA
Laser Ionozation
Other
150
100
-40
15
10
5
0
-5
-10
-15
15
10
5
0
-5
-10
-15
15
10
5
0
-5
-10
-15
-40
-30
-20
-10
U
e
[MeV]
U
e [MeV]
U
e
[MeV]
-30
-20
-10
-40
-30
-20
-10
-40
-30
-20
-10
50
Z [μ m]
Z [μ m]
-40
-30
-20
-10
Z [μ m]
-40
-30
-20
-10
Z [μ m]
X [μ m]
X [μ m]
X [μ m]
Z [μ m]
Z [μ m]
0
a
d
e
f
b
c
-50
200
150
100
50
0
-50
200
150
100
50
0
-50
Fig. 8.3 Nine particle tracks which highlight the characteristic features of each injection mechanism. Three LIDA tracks are plotted in red, blue, and green in (a) and (d); three laser ionizationinjection tracks are plotted in black, pink, and cyan in (b) and (e); three other tracks are plotted in
dark green, orange, and gray in (c) and (f). [Figure 3 in Ref. 2]
8.2 Laser Direct Acceleration
295