

7.8.2 Nano-pillar Array Target
Nano-pillar arrays target is also used for experiment to see the enhancement of the
hard X-ray line emissions [25]. The 2D PIC simulation of the time evolution of
(a) laser electric field and (c) electron density is plotted in Fig. 7.35. The laser pulse
is plotted with blue in (b), and the reflected light pulse is plotted with blue. Then, the
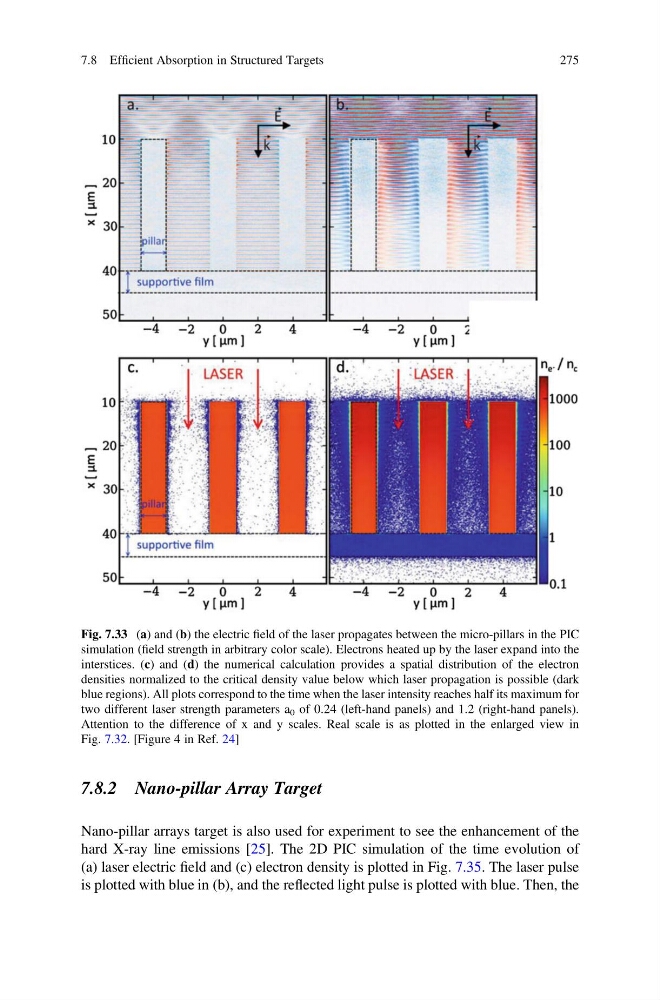
Fig. 7.33 (a) and (b) the electric field of the laser propagates between the micro-pillars in the PIC
simulation (field strength in arbitrary color scale). Electrons heated up by the laser expand into the
interstices. (c) and (d) the numerical calculation provides a spatial distribution of the electron
densities normalized to the critical density value below which laser propagation is possible (dark
blue regions). All plots correspond to the time when the laser intensity reaches half its maximum for
two different laser strength parameters a 0 of 0.24 (left-hand panels) and 1.2 (right-hand panels).
Attention to the difference of x and y scales. Real scale is as plotted in the enlarged view in
Fig. 7.32. [Figure 4 in Ref. 24]
7.8 Efficient Absorption in Structured Targets
275
Nano-pillar arrays target is also used for experiment to see the enhancement of the
hard X-ray line emissions [25]. The 2D PIC simulation of the time evolution of
(a) laser electric field and (c) electron density is plotted in Fig. 7.35. The laser pulse
is plotted with blue in (b), and the reflected light pulse is plotted with blue. Then, the
Fig. 7.33 (a) and (b) the electric field of the laser propagates between the micro-pillars in the PIC
simulation (field strength in arbitrary color scale). Electrons heated up by the laser expand into the
interstices. (c) and (d) the numerical calculation provides a spatial distribution of the electron
densities normalized to the critical density value below which laser propagation is possible (dark
blue regions). All plots correspond to the time when the laser intensity reaches half its maximum for
two different laser strength parameters a 0 of 0.24 (left-hand panels) and 1.2 (right-hand panels).
Attention to the difference of x and y scales. Real scale is as plotted in the enlarged view in
Fig. 7.32. [Figure 4 in Ref. 24]
7.8 Efficient Absorption in Structured Targets
275