

of the front and rear of the aluminum foil. In the case of larger focal spot, such sheath
barrier confines the hot electrons in the wide area of the target surface. 2D PIC
simulation has been done to confirm this at the intensity of 10
19 W/cm
2 . The
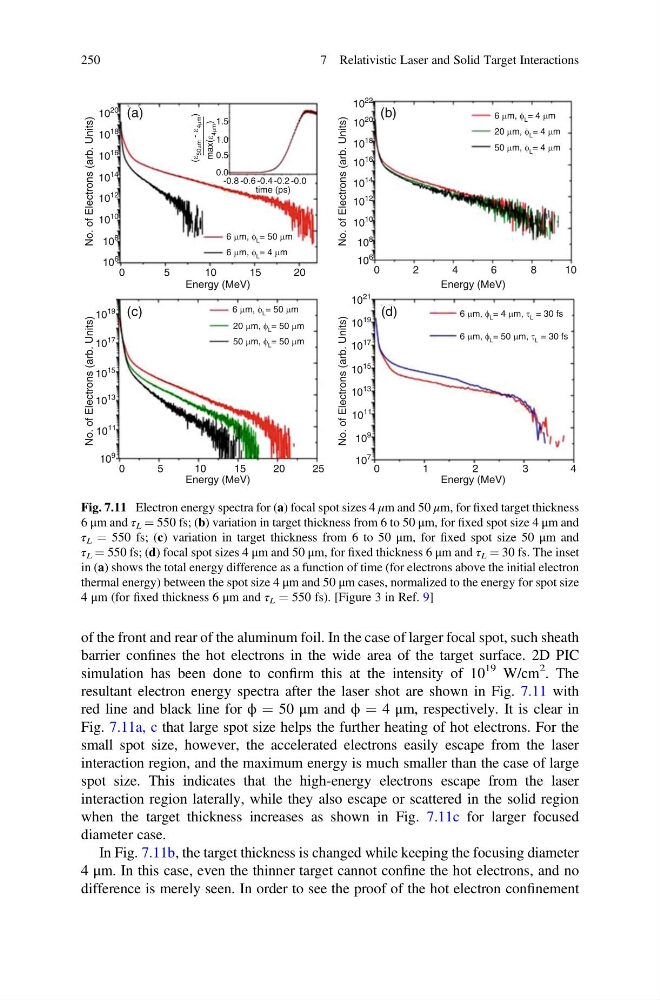
resultant electron energy spectra after the laser shot are shown in Fig. 7.11 with
red line and black line for ϕ ¼ 50 μm and ϕ ¼ 4 μm, respectively. It is clear in
Fig. 7.11a, c that large spot size helps the further heating of hot electrons. For the
small spot size, however, the accelerated electrons easily escape from the laser
interaction region, and the maximum energy is much smaller than the case of large
spot size. This indicates that the high-energy electrons escape from the laser
interaction region laterally, while they also escape or scattered in the solid region
when the target thickness increases as shown in Fig. 7.11c for larger focused
diameter case.
In Fig. 7.11b, the target thickness is changed while keeping the focusing diameter
4 μm. In this case, even the thinner target cannot confine the hot electrons, and no
difference is merely seen. In order to see the proof of the hot electron confinement
10
20
10
22
10
20
10
18
10
16
10
14
10
12
10
10
10
8
10
6
10
21
10
19
10
19
10
17
10
17
10
15
10
15
10
13
10
11
10
9
10
13
10
11
10
9
10
7
10
18
10
16
10
14
1.5
1.0
0.5
0.0
-0.8 -0.6 -0.4 -0.2 -0.0
time (ps)
6 μm, φ L = 50 μm
6 μm, φ L = 4 μm
6 μm, φ L = 50 μm
6 μm, φ L = 4 μm, τ L = 30 fs
6 μm, φ L = 50 μm, τ L = 30 fs
20 μm, φ L = 50 μm
50 μm, φ L = 50 μm
20 μm, φ L = 4 μm
50 μm, φ L = 4 μm
(ε
50μm
-
ε
4μm
)
max(ε
4μm
)
6 μm, φ L = 4 μm
10
12
10
10
10
8
10
6
0
0
0
1
2
3
4
2
4
6
8
1 0
5
(a)
(c)
(d)
(b)
Energy (MeV)
Energy (MeV)
Energy (MeV)
Energy (MeV)
No. of Electrons (arb. Units)
No. of Electrons (arb. Units)
No. of Electrons (arb. Units)
No. of Electrons (arb. Units)
10
15
20
0
5
10
15
20
25
Fig. 7.11 Electron energy spectra for (a) focal spot sizes 4 μm and 50 μm, for fixed target thickness
6 μm and τ L ¼ 550 fs; (b) variation in target thickness from 6 to 50 μm, for fixed spot size 4 μm and
τ L ¼ 550 fs; (c) variation in target thickness from 6 to 50 μm, for fixed spot size 50 μm and
τ L ¼ 550 fs; (d) focal spot sizes 4 μm and 50 μm, for fixed thickness 6 μm and τ L ¼ 30 fs. The inset
in (a) shows the total energy difference as a function of time (for electrons above the initial electron
thermal energy) between the spot size 4 μm and 50 μm cases, normalized to the energy for spot size
4 μm (for fixed thickness 6 μm and τ L ¼ 550 fs). [Figure 3 in Ref. 9]
250
7 Relativistic Laser and Solid Target Interactions
barrier confines the hot electrons in the wide area of the target surface. 2D PIC
simulation has been done to confirm this at the intensity of 10
19 W/cm
2 . The
resultant electron energy spectra after the laser shot are shown in Fig. 7.11 with
red line and black line for ϕ ¼ 50 μm and ϕ ¼ 4 μm, respectively. It is clear in
Fig. 7.11a, c that large spot size helps the further heating of hot electrons. For the
small spot size, however, the accelerated electrons easily escape from the laser
interaction region, and the maximum energy is much smaller than the case of large
spot size. This indicates that the high-energy electrons escape from the laser
interaction region laterally, while they also escape or scattered in the solid region
when the target thickness increases as shown in Fig. 7.11c for larger focused
diameter case.
In Fig. 7.11b, the target thickness is changed while keeping the focusing diameter
4 μm. In this case, even the thinner target cannot confine the hot electrons, and no
difference is merely seen. In order to see the proof of the hot electron confinement
10
20
10
22
10
20
10
18
10
16
10
14
10
12
10
10
10
8
10
6
10
21
10
19
10
19
10
17
10
17
10
15
10
15
10
13
10
11
10
9
10
13
10
11
10
9
10
7
10
18
10
16
10
14
1.5
1.0
0.5
0.0
-0.8 -0.6 -0.4 -0.2 -0.0
time (ps)
6 μm, φ L = 50 μm
6 μm, φ L = 4 μm
6 μm, φ L = 50 μm
6 μm, φ L = 4 μm, τ L = 30 fs
6 μm, φ L = 50 μm, τ L = 30 fs
20 μm, φ L = 50 μm
50 μm, φ L = 50 μm
20 μm, φ L = 4 μm
50 μm, φ L = 4 μm
(ε
50μm
-
ε
4μm
)
max(ε
4μm
)
6 μm, φ L = 4 μm
10
12
10
10
10
8
10
6
0
0
0
1
2
3
4
2
4
6
8
1 0
5
(a)
(c)
(d)
(b)
Energy (MeV)
Energy (MeV)
Energy (MeV)
Energy (MeV)
No. of Electrons (arb. Units)
No. of Electrons (arb. Units)
No. of Electrons (arb. Units)
No. of Electrons (arb. Units)
10
15
20
0
5
10
15
20
25
Fig. 7.11 Electron energy spectra for (a) focal spot sizes 4 μm and 50 μm, for fixed target thickness
6 μm and τ L ¼ 550 fs; (b) variation in target thickness from 6 to 50 μm, for fixed spot size 4 μm and
τ L ¼ 550 fs; (c) variation in target thickness from 6 to 50 μm, for fixed spot size 50 μm and
τ L ¼ 550 fs; (d) focal spot sizes 4 μm and 50 μm, for fixed thickness 6 μm and τ L ¼ 30 fs. The inset
in (a) shows the total energy difference as a function of time (for electrons above the initial electron
thermal energy) between the spot size 4 μm and 50 μm cases, normalized to the energy for spot size
4 μm (for fixed thickness 6 μm and τ L ¼ 550 fs). [Figure 3 in Ref. 9]
250
7 Relativistic Laser and Solid Target Interactions