

sensitivity, FHELIX laser at GSI with longer pulse of 700+-100 fs and larger laser
energy of 4–180 J at λ ¼ 1.053 μm was used for absorption experiment. The targets
are aluminum foil, and the laser is irradiated normally on the target in the same
condition as the experiment shown in Fig. 7.9a. In order to study the sensitivity to the
focusing diameter ϕ, it was varied over the range, ϕ ¼ 4–270 μm. The effect of the
target thickness was studied by varying the thickness from 6 to 50 μm. The laser
energy contrast of the ASE pedestal was kept very small about 1.4 Â 10
À5 same as in
the case of Fig. 7.7. Although the energy of the pedestal is reduced, the expanding
plasma by ion motion is produced during the relatively long pulse duration.
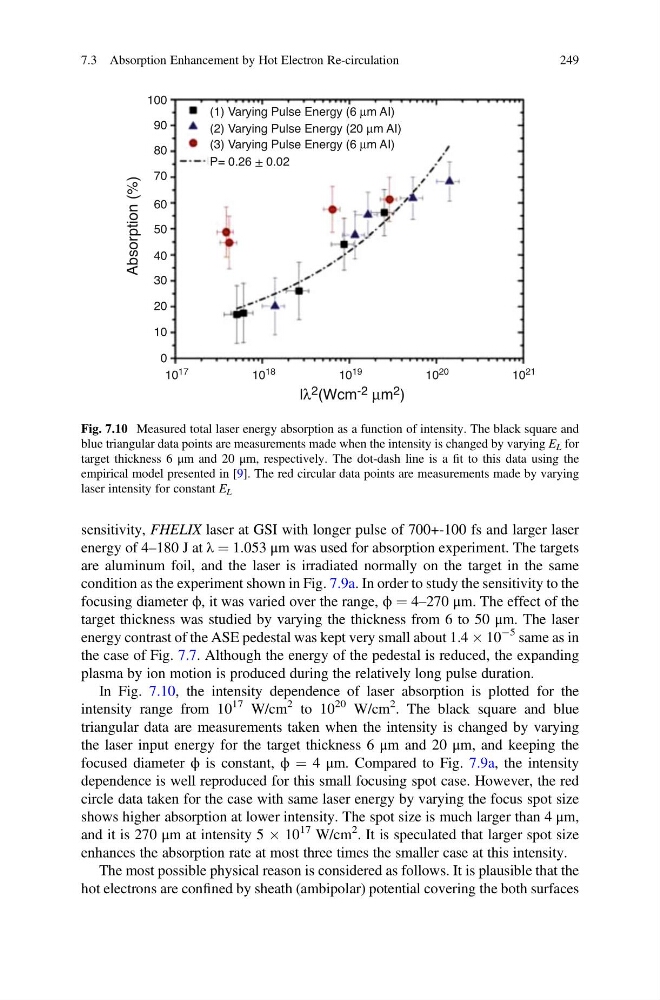
In Fig. 7.10, the intensity dependence of laser absorption is plotted for the
intensity range from 10
17 W/cm
2 to 10
20 W/cm
2 . The black square and blue
triangular data are measurements taken when the intensity is changed by varying
the laser input energy for the target thickness 6 μm and 20 μm, and keeping the
focused diameter ϕ is constant, ϕ ¼ 4 μm. Compared to Fig. 7.9a, the intensity
dependence is well reproduced for this small focusing spot case. However, the red
circle data taken for the case with same laser energy by varying the focus spot size
shows higher absorption at lower intensity. The spot size is much larger than 4 μm,
and it is 270 μm at intensity 5 Â 10
17 W/cm
2 . It is speculated that larger spot size
enhances the absorption rate at most three times the smaller case at this intensity.
The most possible physical reason is considered as follows. It is plausible that the
hot electrons are confined by sheath (ambipolar) potential covering the both surfaces
100
(1) Varying Pulse Energy (6 μm AI)
(2) Varying Pulse Energy (20 μm AI)
(3) Varying Pulse Energy (6 μm AI)
P= 0.26 ± 0.02
Absorption (%)
90
80
70
60
50
40
30
20
10
0
10
17
10
18
lλ 2 (Wcm -2 μm 2 )
10
19
10
20
10
21
Fig. 7.10 Measured total laser energy absorption as a function of intensity. The black square and
blue triangular data points are measurements made when the intensity is changed by varying E L for
target thickness 6 μm and 20 μm, respectively. The dot-dash line is a fit to this data using the
empirical model presented in [9]. The red circular data points are measurements made by varying
laser intensity for constant E L
7.3 Absorption Enhancement by Hot Electron Re-circulation
249
energy of 4–180 J at λ ¼ 1.053 μm was used for absorption experiment. The targets
are aluminum foil, and the laser is irradiated normally on the target in the same
condition as the experiment shown in Fig. 7.9a. In order to study the sensitivity to the
focusing diameter ϕ, it was varied over the range, ϕ ¼ 4–270 μm. The effect of the
target thickness was studied by varying the thickness from 6 to 50 μm. The laser
energy contrast of the ASE pedestal was kept very small about 1.4 Â 10
À5 same as in
the case of Fig. 7.7. Although the energy of the pedestal is reduced, the expanding
plasma by ion motion is produced during the relatively long pulse duration.
In Fig. 7.10, the intensity dependence of laser absorption is plotted for the
intensity range from 10
17 W/cm
2 to 10
20 W/cm
2 . The black square and blue
triangular data are measurements taken when the intensity is changed by varying
the laser input energy for the target thickness 6 μm and 20 μm, and keeping the
focused diameter ϕ is constant, ϕ ¼ 4 μm. Compared to Fig. 7.9a, the intensity
dependence is well reproduced for this small focusing spot case. However, the red
circle data taken for the case with same laser energy by varying the focus spot size
shows higher absorption at lower intensity. The spot size is much larger than 4 μm,
and it is 270 μm at intensity 5 Â 10
17 W/cm
2 . It is speculated that larger spot size
enhances the absorption rate at most three times the smaller case at this intensity.
The most possible physical reason is considered as follows. It is plausible that the
hot electrons are confined by sheath (ambipolar) potential covering the both surfaces
100
(1) Varying Pulse Energy (6 μm AI)
(2) Varying Pulse Energy (20 μm AI)
(3) Varying Pulse Energy (6 μm AI)
P= 0.26 ± 0.02
Absorption (%)
90
80
70
60
50
40
30
20
10
0
10
17
10
18
lλ 2 (Wcm -2 μm 2 )
10
19
10
20
10
21
Fig. 7.10 Measured total laser energy absorption as a function of intensity. The black square and
blue triangular data points are measurements made when the intensity is changed by varying E L for
target thickness 6 μm and 20 μm, respectively. The dot-dash line is a fit to this data using the
empirical model presented in [9]. The red circular data points are measurements made by varying
laser intensity for constant E L
7.3 Absorption Enhancement by Hot Electron Re-circulation
249