

angle, and the plus angle is that to the target normal direction, while the minus is
opposite.
In Fig. 7.3a, a large amount of hot electrons is observed for sharp density profile
case, while this signal disappears with increase of L/λ. It is clear that the relativistic
vacuum heating effectively works for L/λ < 0.2 ~ 0.3. It is seen, however, that for
L/λ > 0.3, the hot electrons are ejected to the different direction (angle ~
À200 mrad). The physical mechanism of the electron heating will be discussed
later, and here we just pointed out that in Ref. [3] it is concluded that stochastic
heating produces hot electrons in such regime.
Associated with the hot electrons generation via the vacuum heating, HHG are
observed for L/λ < 0.2 as seen in Fig. 7.3b, where the intensity distribution of the
spectra of the scattered light reflected to the specular direction is plotted. The higher
harmonics of more than 30 are observed. Note that the maximum frequency given in
(3.12.3) is about 50. It is clear that with increase of the density scale length, the
maximum of the harmonic number decreases, and they disappear for the normalized
density scale more than 0.2.
For comparison, 3D and 2D PIC simulations are also carried out [3]. The hot
electron ejected outward and inward directions of the solid targets are well
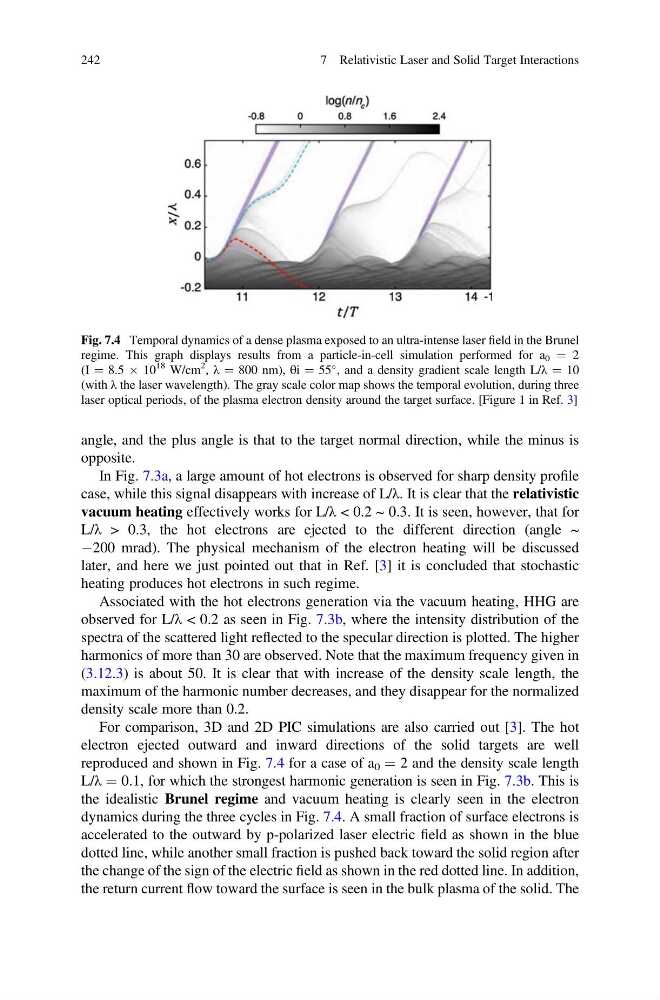
reproduced and shown in Fig. 7.4 for a case of a 0 ¼ 2 and the density scale length
L/λ ¼ 0.1, for which the strongest harmonic generation is seen in Fig. 7.3b. This is
the idealistic Brunel regime and vacuum heating is clearly seen in the electron
dynamics during the three cycles in Fig. 7.4. A small fraction of surface electrons is
accelerated to the outward by p-polarized laser electric field as shown in the blue
dotted line, while another small fraction is pushed back toward the solid region after
the change of the sign of the electric field as shown in the red dotted line. In addition,
the return current flow toward the surface is seen in the bulk plasma of the solid. The
Fig. 7.4 Temporal dynamics of a dense plasma exposed to an ultra-intense laser field in the Brunel
regime. This graph displays results from a particle-in-cell simulation performed for a 0 ¼ 2
(I ¼ 8.5 Â 10
18 W/cm
2
, λ ¼ 800 nm), θi ¼ 55
, and a density gradient scale length L/λ ¼ 10
(with λ the laser wavelength). The gray scale color map shows the temporal evolution, during three
laser optical periods, of the plasma electron density around the target surface. [Figure 1 in Ref. 3]
242
7 Relativistic Laser and Solid Target Interactions
opposite.
In Fig. 7.3a, a large amount of hot electrons is observed for sharp density profile
case, while this signal disappears with increase of L/λ. It is clear that the relativistic
vacuum heating effectively works for L/λ < 0.2 ~ 0.3. It is seen, however, that for
L/λ > 0.3, the hot electrons are ejected to the different direction (angle ~
À200 mrad). The physical mechanism of the electron heating will be discussed
later, and here we just pointed out that in Ref. [3] it is concluded that stochastic
heating produces hot electrons in such regime.
Associated with the hot electrons generation via the vacuum heating, HHG are
observed for L/λ < 0.2 as seen in Fig. 7.3b, where the intensity distribution of the
spectra of the scattered light reflected to the specular direction is plotted. The higher
harmonics of more than 30 are observed. Note that the maximum frequency given in
(3.12.3) is about 50. It is clear that with increase of the density scale length, the
maximum of the harmonic number decreases, and they disappear for the normalized
density scale more than 0.2.
For comparison, 3D and 2D PIC simulations are also carried out [3]. The hot
electron ejected outward and inward directions of the solid targets are well
reproduced and shown in Fig. 7.4 for a case of a 0 ¼ 2 and the density scale length
L/λ ¼ 0.1, for which the strongest harmonic generation is seen in Fig. 7.3b. This is
the idealistic Brunel regime and vacuum heating is clearly seen in the electron
dynamics during the three cycles in Fig. 7.4. A small fraction of surface electrons is
accelerated to the outward by p-polarized laser electric field as shown in the blue
dotted line, while another small fraction is pushed back toward the solid region after
the change of the sign of the electric field as shown in the red dotted line. In addition,
the return current flow toward the surface is seen in the bulk plasma of the solid. The
Fig. 7.4 Temporal dynamics of a dense plasma exposed to an ultra-intense laser field in the Brunel
regime. This graph displays results from a particle-in-cell simulation performed for a 0 ¼ 2
(I ¼ 8.5 Â 10
18 W/cm
2
, λ ¼ 800 nm), θi ¼ 55
, and a density gradient scale length L/λ ¼ 10
(with λ the laser wavelength). The gray scale color map shows the temporal evolution, during three
laser optical periods, of the plasma electron density around the target surface. [Figure 1 in Ref. 3]
242
7 Relativistic Laser and Solid Target Interactions