

return current electrons flow from the inside to the surface. For example, the return
current flow starting from the time of 12 to 12.5 is seen the black region in Fig. 7.4.
Suck cycle schematically shown in Fig. 3.33 is confirmed in the simulation. Then,
the same process repeats for the new fraction of electrons supplied as return current
form the solid region. The hot electrons observed in Fig. 7.3a are the component
accelerated to the direction of the p-polarized electric field.
The electron dynamics in Fig. 7.4 looks very coherent over three period. The
pulse duration is 20–25 fs, and it is very short so that almost no ion motion couple to
the electron dynamics. As pointed out later, for the pulse duration more than 100 fs,
roughly speaking, the ion motion during the main pulse makes the pre-formed
plasma, and HHG and absorption of laser are significantly affected. As we see
later, the laser intensity, pulse length and pre-formed plasmas are very important
to know the physics of laser-matter interaction.
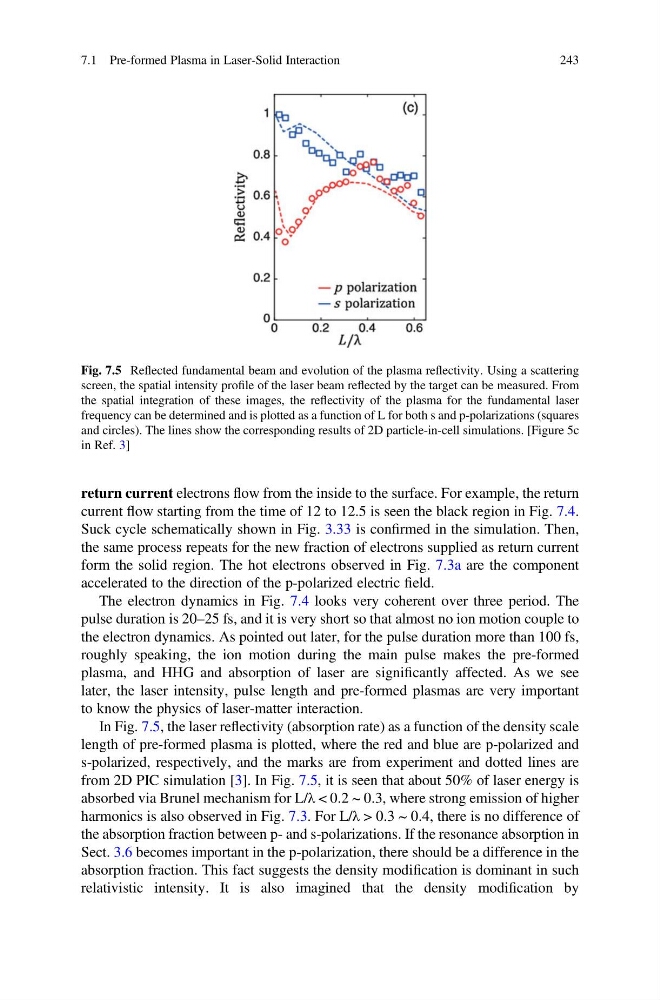
In Fig. 7.5, the laser reflectivity (absorption rate) as a function of the density scale
length of pre-formed plasma is plotted, where the red and blue are p-polarized and
s-polarized, respectively, and the marks are from experiment and dotted lines are
from 2D PIC simulation [3]. In Fig. 7.5, it is seen that about 50% of laser energy is
absorbed via Brunel mechanism for L/λ < 0.2 ~ 0.3, where strong emission of higher
harmonics is also observed in Fig. 7.3. For L/λ > 0.3 ~ 0.4, there is no difference of
the absorption fraction between p- and s-polarizations. If the resonance absorption in
Sect. 3.6 becomes important in the p-polarization, there should be a difference in the
absorption fraction. This fact suggests the density modification is dominant in such
relativistic intensity. It is also imagined that the density modification by
Fig. 7.5 Reflected fundamental beam and evolution of the plasma reflectivity. Using a scattering
screen, the spatial intensity profile of the laser beam reflected by the target can be measured. From
the spatial integration of these images, the reflectivity of the plasma for the fundamental laser
frequency can be determined and is plotted as a function of L for both s and p-polarizations (squares
and circles). The lines show the corresponding results of 2D particle-in-cell simulations. [Figure 5c
in Ref. 3]
7.1 Pre-formed Plasma in Laser-Solid Interaction
243
current flow starting from the time of 12 to 12.5 is seen the black region in Fig. 7.4.
Suck cycle schematically shown in Fig. 3.33 is confirmed in the simulation. Then,
the same process repeats for the new fraction of electrons supplied as return current
form the solid region. The hot electrons observed in Fig. 7.3a are the component
accelerated to the direction of the p-polarized electric field.
The electron dynamics in Fig. 7.4 looks very coherent over three period. The
pulse duration is 20–25 fs, and it is very short so that almost no ion motion couple to
the electron dynamics. As pointed out later, for the pulse duration more than 100 fs,
roughly speaking, the ion motion during the main pulse makes the pre-formed
plasma, and HHG and absorption of laser are significantly affected. As we see
later, the laser intensity, pulse length and pre-formed plasmas are very important
to know the physics of laser-matter interaction.
In Fig. 7.5, the laser reflectivity (absorption rate) as a function of the density scale
length of pre-formed plasma is plotted, where the red and blue are p-polarized and
s-polarized, respectively, and the marks are from experiment and dotted lines are
from 2D PIC simulation [3]. In Fig. 7.5, it is seen that about 50% of laser energy is
absorbed via Brunel mechanism for L/λ < 0.2 ~ 0.3, where strong emission of higher
harmonics is also observed in Fig. 7.3. For L/λ > 0.3 ~ 0.4, there is no difference of
the absorption fraction between p- and s-polarizations. If the resonance absorption in
Sect. 3.6 becomes important in the p-polarization, there should be a difference in the
absorption fraction. This fact suggests the density modification is dominant in such
relativistic intensity. It is also imagined that the density modification by
Fig. 7.5 Reflected fundamental beam and evolution of the plasma reflectivity. Using a scattering
screen, the spatial intensity profile of the laser beam reflected by the target can be measured. From
the spatial integration of these images, the reflectivity of the plasma for the fundamental laser
frequency can be determined and is plotted as a function of L for both s and p-polarizations (squares
and circles). The lines show the corresponding results of 2D particle-in-cell simulations. [Figure 5c
in Ref. 3]
7.1 Pre-formed Plasma in Laser-Solid Interaction
243