

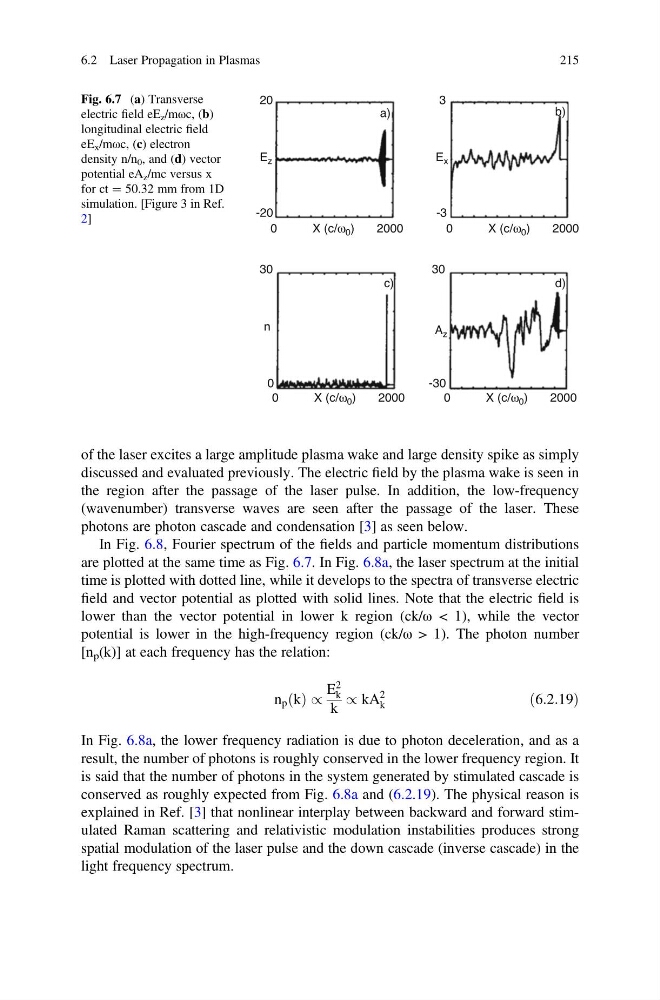
of the laser excites a large amplitude plasma wake and large density spike as simply
discussed and evaluated previously. The electric field by the plasma wake is seen in
the region after the passage of the laser pulse. In addition, the low-frequency
(wavenumber) transverse waves are seen after the passage of the laser. These
photons are photon cascade and condensation [3] as seen below.
In Fig. 6.8, Fourier spectrum of the fields and particle momentum distributions
are plotted at the same time as Fig. 6.7. In Fig. 6.8a, the laser spectrum at the initial
time is plotted with dotted line, while it develops to the spectra of transverse electric
field and vector potential as plotted with solid lines. Note that the electric field is
lower than the vector potential in lower k region (ck/ω < 1), while the vector
potential is lower in the high-frequency region (ck/ω > 1). The photon number
[n p (k)] at each frequency has the relation:
n p k
ð Þ /
E
2
k
k
/ kA
2
k
ð6:2:19Þ
In Fig. 6.8a, the lower frequency radiation is due to photon deceleration, and as a
result, the number of photons is roughly conserved in the lower frequency region. It
is said that the number of photons in the system generated by stimulated cascade is
conserved as roughly expected from Fig. 6.8a and (6.2.19). The physical reason is
explained in Ref. [3] that nonlinear interplay between backward and forward stimulated Raman scattering and relativistic modulation instabilities produces strong
spatial modulation of the laser pulse and the down cascade (inverse cascade) in the
light frequency spectrum.
20
-20
0
a)
b)
c)
d)
n
A z
0
-30
2000
3
30
30
-3
X (c/ω 0 )
0
2000
X (c/ω 0 )
0
2000
X (c/ω 0 )
0
2000
X (c/ω 0 )
E z
E x
Fig. 6.7 (a) Transverse
electric field eE z /mωc, (b)
longitudinal electric field
eE x /mωc, (c) electron
density n/n 0 , and (d) vector
potential eA z /mc versus x
for ct ¼ 50.32 mm from 1D
simulation. [Figure 3 in Ref.
2]
6.2 Laser Propagation in Plasmas
215
discussed and evaluated previously. The electric field by the plasma wake is seen in
the region after the passage of the laser pulse. In addition, the low-frequency
(wavenumber) transverse waves are seen after the passage of the laser. These
photons are photon cascade and condensation [3] as seen below.
In Fig. 6.8, Fourier spectrum of the fields and particle momentum distributions
are plotted at the same time as Fig. 6.7. In Fig. 6.8a, the laser spectrum at the initial
time is plotted with dotted line, while it develops to the spectra of transverse electric
field and vector potential as plotted with solid lines. Note that the electric field is
lower than the vector potential in lower k region (ck/ω < 1), while the vector
potential is lower in the high-frequency region (ck/ω > 1). The photon number
[n p (k)] at each frequency has the relation:
n p k
ð Þ /
E
2
k
k
/ kA
2
k
ð6:2:19Þ
In Fig. 6.8a, the lower frequency radiation is due to photon deceleration, and as a
result, the number of photons is roughly conserved in the lower frequency region. It
is said that the number of photons in the system generated by stimulated cascade is
conserved as roughly expected from Fig. 6.8a and (6.2.19). The physical reason is
explained in Ref. [3] that nonlinear interplay between backward and forward stimulated Raman scattering and relativistic modulation instabilities produces strong
spatial modulation of the laser pulse and the down cascade (inverse cascade) in the
light frequency spectrum.
20
-20
0
a)
b)
c)
d)
n
A z
0
-30
2000
3
30
30
-3
X (c/ω 0 )
0
2000
X (c/ω 0 )
0
2000
X (c/ω 0 )
0
2000
X (c/ω 0 )
E z
E x
Fig. 6.7 (a) Transverse
electric field eE z /mωc, (b)
longitudinal electric field
eE x /mωc, (c) electron
density n/n 0 , and (d) vector
potential eA z /mc versus x
for ct ¼ 50.32 mm from 1D
simulation. [Figure 3 in Ref.
2]
6.2 Laser Propagation in Plasmas
215