

(4.4.13). The spreads of the two peaks can be related to property of Landau damping
which is mainly determined by the ion temperature. The electron and ion
temperatures are identified by comparing to the theoretical curve plotted with the
dashed line in Fig. 4.9. In Ref. [8], it is reported that Te~500 Æ 20 ev, Ti~100 Æ 30 ev
from this comparison. In addition, the dispersion relations yield n e /n cr ~ 0.3, and the
wavenumber of the plasma wave in SRS is kλ De ¼ 0.33 À 0.35.
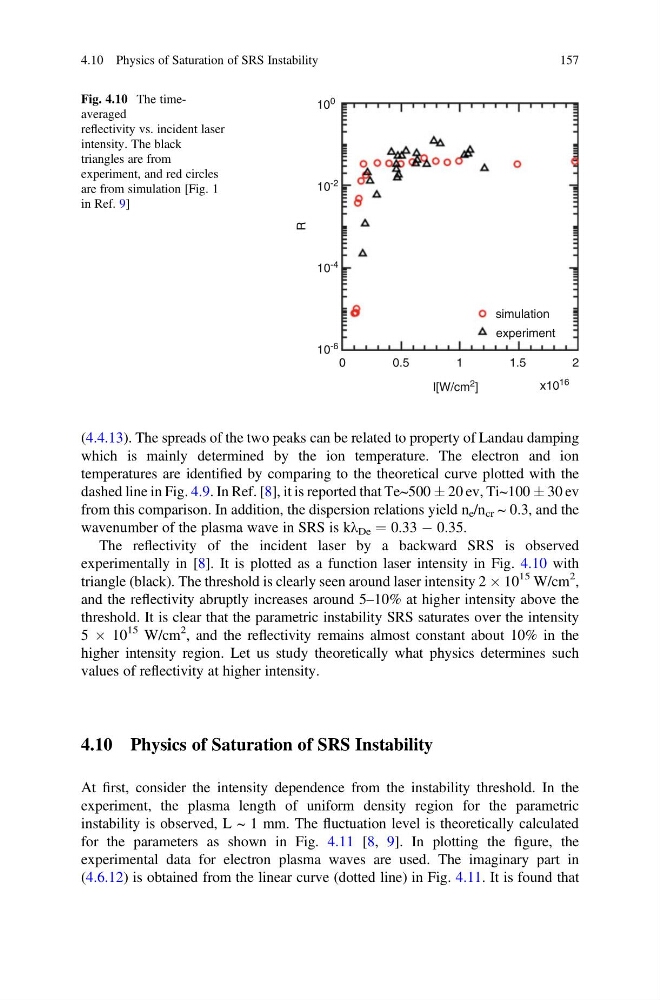
The reflectivity of the incident laser by a backward SRS is observed
experimentally in [8]. It is plotted as a function laser intensity in Fig. 4.10 with
triangle (black). The threshold is clearly seen around laser intensity 2 Â 10
15 W/cm
2 ,
and the reflectivity abruptly increases around 5–10% at higher intensity above the
threshold. It is clear that the parametric instability SRS saturates over the intensity
5 Â 10
15 W/cm
2 , and the reflectivity remains almost constant about 10% in the
higher intensity region. Let us study theoretically what physics determines such
values of reflectivity at higher intensity.
4.10 Physics of Saturation of SRS Instability
At first, consider the intensity dependence from the instability threshold. In the
experiment, the plasma length of uniform density region for the parametric
instability is observed, L ~ 1 mm. The fluctuation level is theoretically calculated
for the parameters as shown in Fig. 4.11 [8, 9]. In plotting the figure, the
experimental data for electron plasma waves are used. The imaginary part in
(4.6.12) is obtained from the linear curve (dotted line) in Fig. 4.11. It is found that
10
0
10
-2
10 -4
simulation
experiment
10 -6
0
0.5
1
I[W/cm 2 ]
x10 16
1.5
2
R
Fig. 4.10 The timeaveraged
reflectivity vs. incident laser
intensity. The black
triangles are from
experiment, and red circles
are from simulation [Fig. 1
in Ref. 9]
4.10 Physics of Saturation of SRS Instability
157
which is mainly determined by the ion temperature. The electron and ion
temperatures are identified by comparing to the theoretical curve plotted with the
dashed line in Fig. 4.9. In Ref. [8], it is reported that Te~500 Æ 20 ev, Ti~100 Æ 30 ev
from this comparison. In addition, the dispersion relations yield n e /n cr ~ 0.3, and the
wavenumber of the plasma wave in SRS is kλ De ¼ 0.33 À 0.35.
The reflectivity of the incident laser by a backward SRS is observed
experimentally in [8]. It is plotted as a function laser intensity in Fig. 4.10 with
triangle (black). The threshold is clearly seen around laser intensity 2 Â 10
15 W/cm
2 ,
and the reflectivity abruptly increases around 5–10% at higher intensity above the
threshold. It is clear that the parametric instability SRS saturates over the intensity
5 Â 10
15 W/cm
2 , and the reflectivity remains almost constant about 10% in the
higher intensity region. Let us study theoretically what physics determines such
values of reflectivity at higher intensity.
4.10 Physics of Saturation of SRS Instability
At first, consider the intensity dependence from the instability threshold. In the
experiment, the plasma length of uniform density region for the parametric
instability is observed, L ~ 1 mm. The fluctuation level is theoretically calculated
for the parameters as shown in Fig. 4.11 [8, 9]. In plotting the figure, the
experimental data for electron plasma waves are used. The imaginary part in
(4.6.12) is obtained from the linear curve (dotted line) in Fig. 4.11. It is found that
10
0
10
-2
10 -4
simulation
experiment
10 -6
0
0.5
1
I[W/cm 2 ]
x10 16
1.5
2
R
Fig. 4.10 The timeaveraged
reflectivity vs. incident laser
intensity. The black
triangles are from
experiment, and red circles
are from simulation [Fig. 1
in Ref. 9]
4.10 Physics of Saturation of SRS Instability
157