

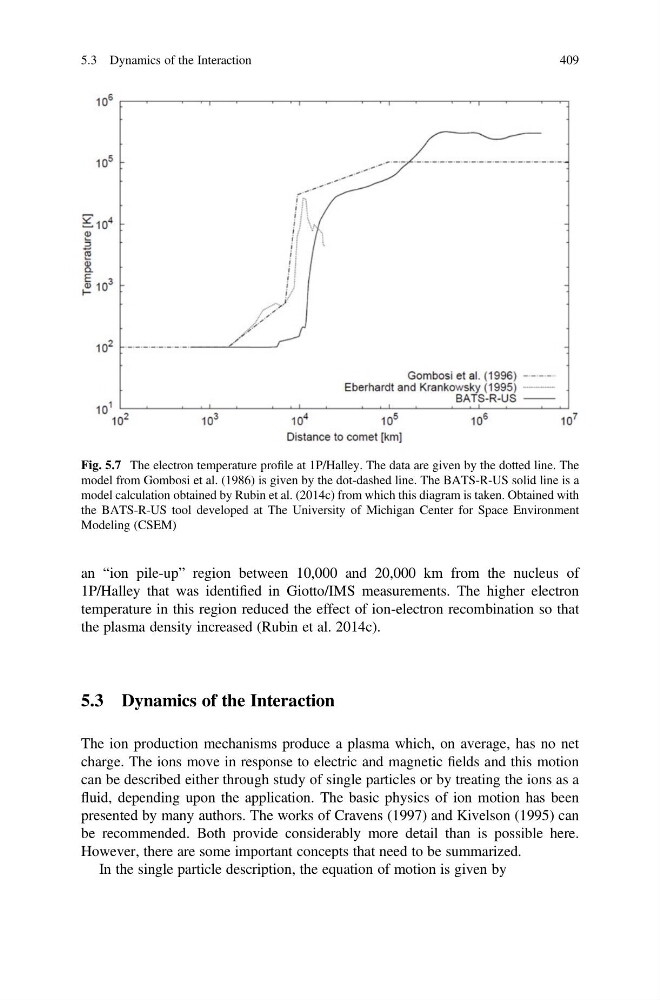
an “ion pile-up” region between 10,000 and 20,000 km from the nucleus of
1P/Halley that was identified in Giotto/IMS measurements. The higher electron
temperature in this region reduced the effect of ion-electron recombination so that
the plasma density increased (Rubin et al. 2014c).
5.3 Dynamics of the Interaction
The ion production mechanisms produce a plasma which, on average, has no net
charge. The ions move in response to electric and magnetic fields and this motion
can be described either through study of single particles or by treating the ions as a
fluid, depending upon the application. The basic physics of ion motion has been
presented by many authors. The works of Cravens (1997) and Kivelson (1995) can
be recommended. Both provide considerably more detail than is possible here.
However, there are some important concepts that need to be summarized.
In the single particle description, the equation of motion is given by
Fig. 5.7 The electron temperature profile at 1P/Halley. The data are given by the dotted line. The
model from Gombosi et al. (1986) is given by the dot-dashed line. The BATS-R-US solid line is a
model calculation obtained by Rubin et al. (2014c) from which this diagram is taken. Obtained with
the BATS-R-US tool developed at The University of Michigan Center for Space Environment
Modeling (CSEM)
5.3 Dynamics of the Interaction
409
1P/Halley that was identified in Giotto/IMS measurements. The higher electron
temperature in this region reduced the effect of ion-electron recombination so that
the plasma density increased (Rubin et al. 2014c).
5.3 Dynamics of the Interaction
The ion production mechanisms produce a plasma which, on average, has no net
charge. The ions move in response to electric and magnetic fields and this motion
can be described either through study of single particles or by treating the ions as a
fluid, depending upon the application. The basic physics of ion motion has been
presented by many authors. The works of Cravens (1997) and Kivelson (1995) can
be recommended. Both provide considerably more detail than is possible here.
However, there are some important concepts that need to be summarized.
In the single particle description, the equation of motion is given by
Fig. 5.7 The electron temperature profile at 1P/Halley. The data are given by the dotted line. The
model from Gombosi et al. (1986) is given by the dot-dashed line. The BATS-R-US solid line is a
model calculation obtained by Rubin et al. (2014c) from which this diagram is taken. Obtained with
the BATS-R-US tool developed at The University of Michigan Center for Space Environment
Modeling (CSEM)
5.3 Dynamics of the Interaction
409