

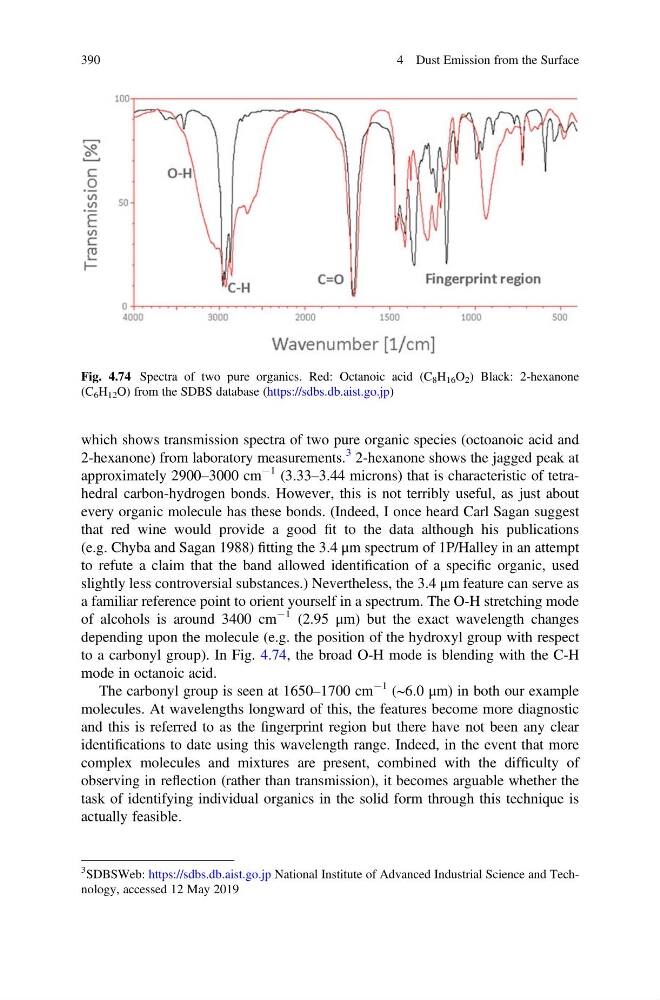
which shows transmission spectra of two pure organic species (octoanoic acid and
2-hexanone) from laboratory measurements.
3 2-hexanone shows the jagged peak at
approximately 2900–3000 cm
À1 (3.33–3.44 microns) that is characteristic of tetrahedral carbon-hydrogen bonds. However, this is not terribly useful, as just about
every organic molecule has these bonds. (Indeed, I once heard Carl Sagan suggest
that red wine would provide a good fit to the data although his publications
(e.g. Chyba and Sagan 1988) fitting the 3.4 μm spectrum of 1P/Halley in an attempt
to refute a claim that the band allowed identification of a specific organic, used
slightly less controversial substances.) Nevertheless, the 3.4 μm feature can serve as
a familiar reference point to orient yourself in a spectrum. The O-H stretching mode
of alcohols is around 3400 cm
À1 (2.95 μm) but the exact wavelength changes
depending upon the molecule (e.g. the position of the hydroxyl group with respect
to a carbonyl group). In Fig. 4.74, the broad O-H mode is blending with the C-H
mode in octanoic acid.
The carbonyl group is seen at 1650–1700 cm
À1 (~6.0 μm) in both our example
molecules. At wavelengths longward of this, the features become more diagnostic
and this is referred to as the fingerprint region but there have not been any clear
identifications to date using this wavelength range. Indeed, in the event that more
complex molecules and mixtures are present, combined with the difficulty of
observing in reflection (rather than transmission), it becomes arguable whether the
task of identifying individual organics in the solid form through this technique is
actually feasible.
Fig. 4.74 Spectra of two pure organics. Red: Octanoic acid (C 8 H 16 O 2 ) Black: 2-hexanone
(C 6 H 12 O) from the SDBS database (https://sdbs.db.aist.go.jp)
3 SDBSWeb: https://sdbs.db.aist.go.jp National Institute of Advanced Industrial Science and Technology, accessed 12 May 2019
390
4 Dust Emission from the Surface
2-hexanone) from laboratory measurements.
3 2-hexanone shows the jagged peak at
approximately 2900–3000 cm
À1 (3.33–3.44 microns) that is characteristic of tetrahedral carbon-hydrogen bonds. However, this is not terribly useful, as just about
every organic molecule has these bonds. (Indeed, I once heard Carl Sagan suggest
that red wine would provide a good fit to the data although his publications
(e.g. Chyba and Sagan 1988) fitting the 3.4 μm spectrum of 1P/Halley in an attempt
to refute a claim that the band allowed identification of a specific organic, used
slightly less controversial substances.) Nevertheless, the 3.4 μm feature can serve as
a familiar reference point to orient yourself in a spectrum. The O-H stretching mode
of alcohols is around 3400 cm
À1 (2.95 μm) but the exact wavelength changes
depending upon the molecule (e.g. the position of the hydroxyl group with respect
to a carbonyl group). In Fig. 4.74, the broad O-H mode is blending with the C-H
mode in octanoic acid.
The carbonyl group is seen at 1650–1700 cm
À1 (~6.0 μm) in both our example
molecules. At wavelengths longward of this, the features become more diagnostic
and this is referred to as the fingerprint region but there have not been any clear
identifications to date using this wavelength range. Indeed, in the event that more
complex molecules and mixtures are present, combined with the difficulty of
observing in reflection (rather than transmission), it becomes arguable whether the
task of identifying individual organics in the solid form through this technique is
actually feasible.
Fig. 4.74 Spectra of two pure organics. Red: Octanoic acid (C 8 H 16 O 2 ) Black: 2-hexanone
(C 6 H 12 O) from the SDBS database (https://sdbs.db.aist.go.jp)
3 SDBSWeb: https://sdbs.db.aist.go.jp National Institute of Advanced Industrial Science and Technology, accessed 12 May 2019
390
4 Dust Emission from the Surface