

observed by Spitzer. Forsterite has a very flat spectrum in the optical and near-IR and
this would be consistent with resolved near-IR spectra from Deep Impact which only
shows features attributable to water ice absorption and only then when water ice is
present on the surface (Sunshine et al. 2006). The phyllosilicate, nontronite, is one of
the more surprising components of the mixture derived from Spitzer data and this
might be compared to the analysis of Stardust particles where no phyllosilicates were
found (Westphal et al. 2017). Furthermore, nontronite has numerous absorption
bands that were not seen in the Deep Impact infrared spectrometer data. Fayalite
has an absorption at around 1 micron that would not have been evident in the near-IR
observations at 9P/Tempel 1. However, Grove et al. (1992) studied three different
grain sizes and the effect of grain size can be seen in the three spectra for fayalite
which are for small (<45 μm), medium (45–125 μm) and large particles
(125–500 μm). Large particles result in a lower reflectance but, in addition and
perhaps not so clearly evident, is that the contrast of the absorption bands decreases
with particle size making the mineral more difficult to identify in mixtures and/or
low signal to noise data. Hence, deduction of detailed composition from remote
sensing data is by no means straightforward.
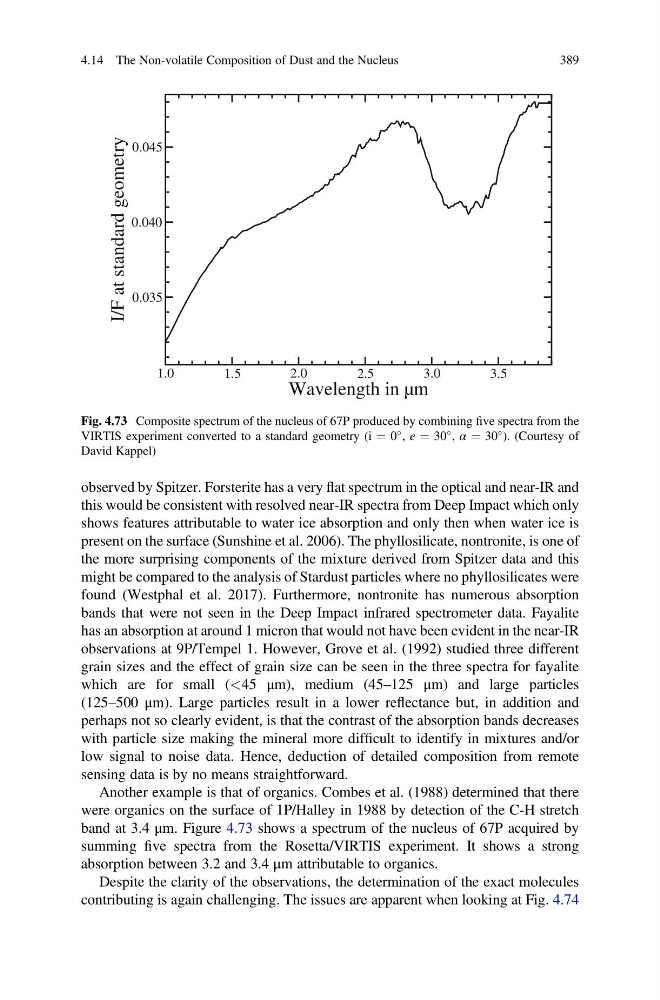
Another example is that of organics. Combes et al. (1988) determined that there
were organics on the surface of 1P/Halley in 1988 by detection of the C-H stretch
band at 3.4 μm. Figure 4.73 shows a spectrum of the nucleus of 67P acquired by
summing five spectra from the Rosetta/VIRTIS experiment. It shows a strong
absorption between 3.2 and 3.4 μm attributable to organics.
Despite the clarity of the observations, the determination of the exact molecules
contributing is again challenging. The issues are apparent when looking at Fig. 4.74
1.0
1.5
2.0
2.5
3.0
3.5
Wavelength in µm
0.035
0.040
0.045
I/F at standard geometry
Fig. 4.73 Composite spectrum of the nucleus of 67P produced by combining five spectra from the
VIRTIS experiment converted to a standard geometry (i ¼ 0
, e ¼ 30
, α ¼ 30
). (Courtesy of
David Kappel)
4.14 The Non-volatile Composition of Dust and the Nucleus
389
this would be consistent with resolved near-IR spectra from Deep Impact which only
shows features attributable to water ice absorption and only then when water ice is
present on the surface (Sunshine et al. 2006). The phyllosilicate, nontronite, is one of
the more surprising components of the mixture derived from Spitzer data and this
might be compared to the analysis of Stardust particles where no phyllosilicates were
found (Westphal et al. 2017). Furthermore, nontronite has numerous absorption
bands that were not seen in the Deep Impact infrared spectrometer data. Fayalite
has an absorption at around 1 micron that would not have been evident in the near-IR
observations at 9P/Tempel 1. However, Grove et al. (1992) studied three different
grain sizes and the effect of grain size can be seen in the three spectra for fayalite
which are for small (<45 μm), medium (45–125 μm) and large particles
(125–500 μm). Large particles result in a lower reflectance but, in addition and
perhaps not so clearly evident, is that the contrast of the absorption bands decreases
with particle size making the mineral more difficult to identify in mixtures and/or
low signal to noise data. Hence, deduction of detailed composition from remote
sensing data is by no means straightforward.
Another example is that of organics. Combes et al. (1988) determined that there
were organics on the surface of 1P/Halley in 1988 by detection of the C-H stretch
band at 3.4 μm. Figure 4.73 shows a spectrum of the nucleus of 67P acquired by
summing five spectra from the Rosetta/VIRTIS experiment. It shows a strong
absorption between 3.2 and 3.4 μm attributable to organics.
Despite the clarity of the observations, the determination of the exact molecules
contributing is again challenging. The issues are apparent when looking at Fig. 4.74
1.0
1.5
2.0
2.5
3.0
3.5
Wavelength in µm
0.035
0.040
0.045
I/F at standard geometry
Fig. 4.73 Composite spectrum of the nucleus of 67P produced by combining five spectra from the
VIRTIS experiment converted to a standard geometry (i ¼ 0
, e ¼ 30
, α ¼ 30
). (Courtesy of
David Kappel)
4.14 The Non-volatile Composition of Dust and the Nucleus
389