

spherically symmetric model and the observation, suggesting that acceleration only
may be sufficient to explain this particular example. On the other hand, details are
probably of considerable importance here and so it is necessary to look at the other
potential processes and their effects. We will look at the process for which we have
the most evidence—slow-moving, non-escaping particles—in a subsequent
sub-section.
4.10.3 Dust Above the Nightside Hemisphere
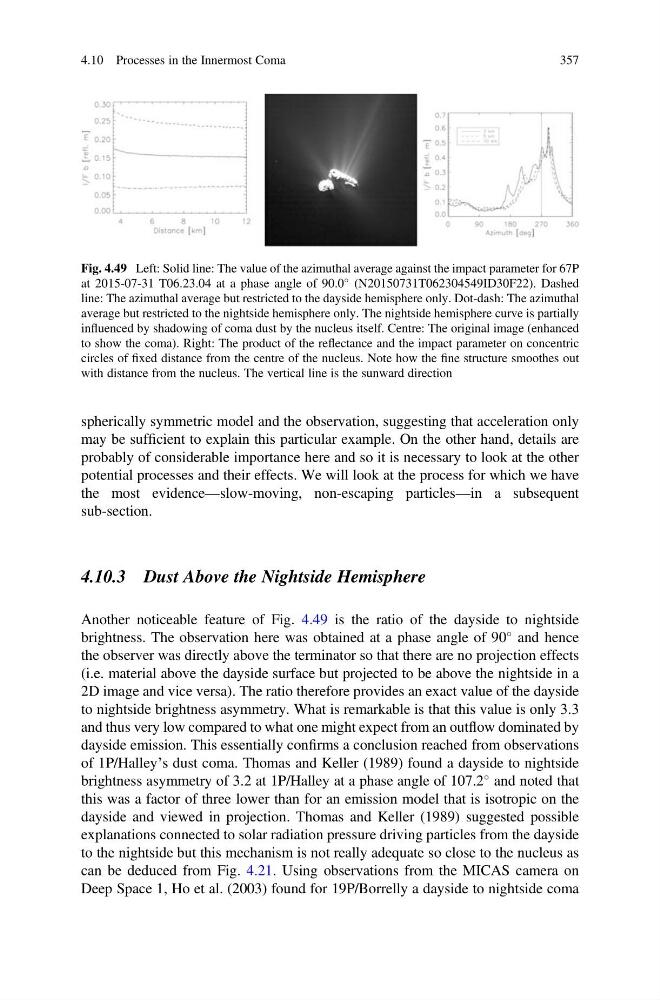
Another noticeable feature of Fig. 4.49 is the ratio of the dayside to nightside
brightness. The observation here was obtained at a phase angle of 90
and hence
the observer was directly above the terminator so that there are no projection effects
(i.e. material above the dayside surface but projected to be above the nightside in a
2D image and vice versa). The ratio therefore provides an exact value of the dayside
to nightside brightness asymmetry. What is remarkable is that this value is only 3.3
and thus very low compared to what one might expect from an outflow dominated by
dayside emission. This essentially confirms a conclusion reached from observations
of 1P/Halley’s dust coma. Thomas and Keller (1989) found a dayside to nightside
brightness asymmetry of 3.2 at 1P/Halley at a phase angle of 107.2
and noted that
this was a factor of three lower than for an emission model that is isotropic on the
dayside and viewed in projection. Thomas and Keller (1989) suggested possible
explanations connected to solar radiation pressure driving particles from the dayside
to the nightside but this mechanism is not really adequate so close to the nucleus as
can be deduced from Fig. 4.21. Using observations from the MICAS camera on
Deep Space 1, Ho et al. (2003) found for 19P/Borrelly a dayside to nightside coma
Fig. 4.49 Left: Solid line: The value of the azimuthal average against the impact parameter for 67P
at 2015-07-31 T06.23.04 at a phase angle of 90.0
(N20150731T062304549ID30F22). Dashed
line: The azimuthal average but restricted to the dayside hemisphere only. Dot-dash: The azimuthal
average but restricted to the nightside hemisphere only. The nightside hemisphere curve is partially
influenced by shadowing of coma dust by the nucleus itself. Centre: The original image (enhanced
to show the coma). Right: The product of the reflectance and the impact parameter on concentric
circles of fixed distance from the centre of the nucleus. Note how the fine structure smoothes out
with distance from the nucleus. The vertical line is the sunward direction
4.10 Processes in the Innermost Coma
357
may be sufficient to explain this particular example. On the other hand, details are
probably of considerable importance here and so it is necessary to look at the other
potential processes and their effects. We will look at the process for which we have
the most evidence—slow-moving, non-escaping particles—in a subsequent
sub-section.
4.10.3 Dust Above the Nightside Hemisphere
Another noticeable feature of Fig. 4.49 is the ratio of the dayside to nightside
brightness. The observation here was obtained at a phase angle of 90
and hence
the observer was directly above the terminator so that there are no projection effects
(i.e. material above the dayside surface but projected to be above the nightside in a
2D image and vice versa). The ratio therefore provides an exact value of the dayside
to nightside brightness asymmetry. What is remarkable is that this value is only 3.3
and thus very low compared to what one might expect from an outflow dominated by
dayside emission. This essentially confirms a conclusion reached from observations
of 1P/Halley’s dust coma. Thomas and Keller (1989) found a dayside to nightside
brightness asymmetry of 3.2 at 1P/Halley at a phase angle of 107.2
and noted that
this was a factor of three lower than for an emission model that is isotropic on the
dayside and viewed in projection. Thomas and Keller (1989) suggested possible
explanations connected to solar radiation pressure driving particles from the dayside
to the nightside but this mechanism is not really adequate so close to the nucleus as
can be deduced from Fig. 4.21. Using observations from the MICAS camera on
Deep Space 1, Ho et al. (2003) found for 19P/Borrelly a dayside to nightside coma
Fig. 4.49 Left: Solid line: The value of the azimuthal average against the impact parameter for 67P
at 2015-07-31 T06.23.04 at a phase angle of 90.0
(N20150731T062304549ID30F22). Dashed
line: The azimuthal average but restricted to the dayside hemisphere only. Dot-dash: The azimuthal
average but restricted to the nightside hemisphere only. The nightside hemisphere curve is partially
influenced by shadowing of coma dust by the nucleus itself. Centre: The original image (enhanced
to show the coma). Right: The product of the reflectance and the impact parameter on concentric
circles of fixed distance from the centre of the nucleus. Note how the fine structure smoothes out
with distance from the nucleus. The vertical line is the sunward direction
4.10 Processes in the Innermost Coma
357