

• Particle sublimation/condensation effects
It might appear that we have made no progress, however, the influences of the
above processes on the behaviour of Eq. 4.106 are different allowing us to use the
observations to constrain which processes are dominant.
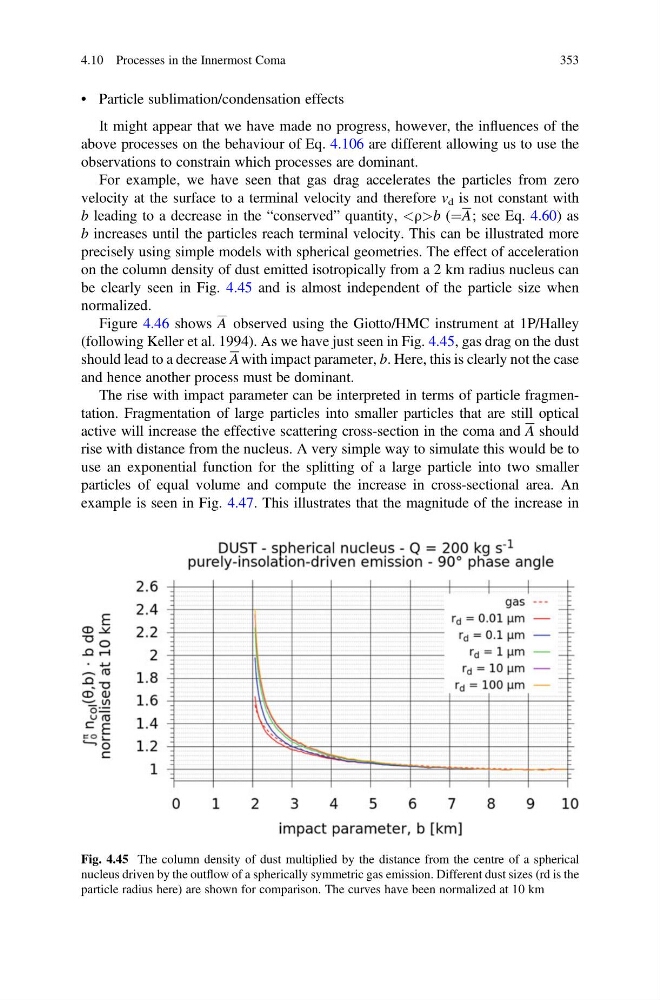
For example, we have seen that gas drag accelerates the particles from zero
velocity at the surface to a terminal velocity and therefore v d is not constant with
b leading to a decrease in the “conserved” quantity, <ρ>b (¼A; see Eq. 4.60) as
b increases until the particles reach terminal velocity. This can be illustrated more
precisely using simple models with spherical geometries. The effect of acceleration
on the column density of dust emitted isotropically from a 2 km radius nucleus can
be clearly seen in Fig. 4.45 and is almost independent of the particle size when
normalized.
Figure 4.46 shows A observed using the Giotto/HMC instrument at 1P/Halley
(following Keller et al. 1994). As we have just seen in Fig. 4.45, gas drag on the dust
should lead to a decrease A with impact parameter, b. Here, this is clearly not the case
and hence another process must be dominant.
The rise with impact parameter can be interpreted in terms of particle fragmentation. Fragmentation of large particles into smaller particles that are still optical
active will increase the effective scattering cross-section in the coma and A should
rise with distance from the nucleus. A very simple way to simulate this would be to
use an exponential function for the splitting of a large particle into two smaller
particles of equal volume and compute the increase in cross-sectional area. An
example is seen in Fig. 4.47. This illustrates that the magnitude of the increase in
Fig. 4.45 The column density of dust multiplied by the distance from the centre of a spherical
nucleus driven by the outflow of a spherically symmetric gas emission. Different dust sizes (rd is the
particle radius here) are shown for comparison. The curves have been normalized at 10 km
4.10 Processes in the Innermost Coma
353
It might appear that we have made no progress, however, the influences of the
above processes on the behaviour of Eq. 4.106 are different allowing us to use the
observations to constrain which processes are dominant.
For example, we have seen that gas drag accelerates the particles from zero
velocity at the surface to a terminal velocity and therefore v d is not constant with
b leading to a decrease in the “conserved” quantity, <ρ>b (¼A; see Eq. 4.60) as
b increases until the particles reach terminal velocity. This can be illustrated more
precisely using simple models with spherical geometries. The effect of acceleration
on the column density of dust emitted isotropically from a 2 km radius nucleus can
be clearly seen in Fig. 4.45 and is almost independent of the particle size when
normalized.
Figure 4.46 shows A observed using the Giotto/HMC instrument at 1P/Halley
(following Keller et al. 1994). As we have just seen in Fig. 4.45, gas drag on the dust
should lead to a decrease A with impact parameter, b. Here, this is clearly not the case
and hence another process must be dominant.
The rise with impact parameter can be interpreted in terms of particle fragmentation. Fragmentation of large particles into smaller particles that are still optical
active will increase the effective scattering cross-section in the coma and A should
rise with distance from the nucleus. A very simple way to simulate this would be to
use an exponential function for the splitting of a large particle into two smaller
particles of equal volume and compute the increase in cross-sectional area. An
example is seen in Fig. 4.47. This illustrates that the magnitude of the increase in
Fig. 4.45 The column density of dust multiplied by the distance from the centre of a spherical
nucleus driven by the outflow of a spherically symmetric gas emission. Different dust sizes (rd is the
particle radius here) are shown for comparison. The curves have been normalized at 10 km
4.10 Processes in the Innermost Coma
353