

It can also be asked whether the dust to gas production rate ratio is constant with
time (and therefore heliocentric distance). In this case, if gas drag alone is responsible for dust loss then the answer is fairly straightforward in that it cannot be
because the maximum liftable mass is a function of the gas production rate which
is itself a function of heliocentric distance. However, the degree to which this simple
relation holds depends on the exact dust ejection mechanism which is still poorly
understood.
4.9.3 Transient Jet/Filament Structures
The imaging systems on Rosetta observed numerous short-lived emission events.
Events seen near perihelion were catalogued by Vincent et al. (2016b). The event
that recorded the highest reflectance is shown in Fig. 4.41. An image acquired
30 min earlier is shown on the top right for comparison. It has been processed in
an identical way. An image 30 min later showed that activity had ceased (at least at
this high level). The maximum reflectance close to the surface was approaching
0.012 in the visible and near-infrared suggesting that the optical depth was still
below one. The curve of growth along the axis of the brightest streamline of the jet
(bottom right) also suggests that the dust was not optically thick.
The opening angle of the transient structure is around 50
full cone angle. This is
similar to results obtained by Kitamura (1986) for axisymmetric dusty gas jets using
sub-micron (a single size of 0.65 μm) dust particles entrained in the gas flow. The
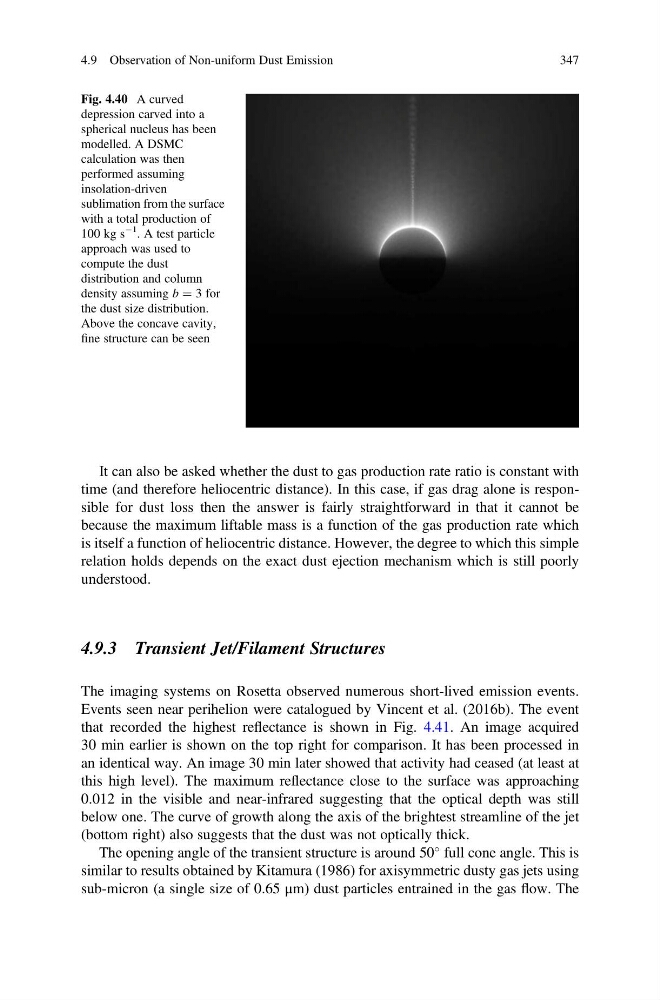
Fig. 4.40 A curved
depression carved into a
spherical nucleus has been
modelled. A DSMC
calculation was then
performed assuming
insolation-driven
sublimation from the surface
with a total production of
100 kg s
À1
. A test particle
approach was used to
compute the dust
distribution and column
density assuming b ¼ 3 for
the dust size distribution.
Above the concave cavity,
fine structure can be seen
4.9 Observation of Non-uniform Dust Emission
347
time (and therefore heliocentric distance). In this case, if gas drag alone is responsible for dust loss then the answer is fairly straightforward in that it cannot be
because the maximum liftable mass is a function of the gas production rate which
is itself a function of heliocentric distance. However, the degree to which this simple
relation holds depends on the exact dust ejection mechanism which is still poorly
understood.
4.9.3 Transient Jet/Filament Structures
The imaging systems on Rosetta observed numerous short-lived emission events.
Events seen near perihelion were catalogued by Vincent et al. (2016b). The event
that recorded the highest reflectance is shown in Fig. 4.41. An image acquired
30 min earlier is shown on the top right for comparison. It has been processed in
an identical way. An image 30 min later showed that activity had ceased (at least at
this high level). The maximum reflectance close to the surface was approaching
0.012 in the visible and near-infrared suggesting that the optical depth was still
below one. The curve of growth along the axis of the brightest streamline of the jet
(bottom right) also suggests that the dust was not optically thick.
The opening angle of the transient structure is around 50
full cone angle. This is
similar to results obtained by Kitamura (1986) for axisymmetric dusty gas jets using
sub-micron (a single size of 0.65 μm) dust particles entrained in the gas flow. The
Fig. 4.40 A curved
depression carved into a
spherical nucleus has been
modelled. A DSMC
calculation was then
performed assuming
insolation-driven
sublimation from the surface
with a total production of
100 kg s
À1
. A test particle
approach was used to
compute the dust
distribution and column
density assuming b ¼ 3 for
the dust size distribution.
Above the concave cavity,
fine structure can be seen
4.9 Observation of Non-uniform Dust Emission
347