

mechanisms. It remains to be seen to what extent deviations from idealised modelling cases blur this distinction.
In the above, we have touched on the question of whether the dust to gas
production rate ratio from a specific source area is a constant over a cometary
nucleus. It is almost self-evident that at some scale this assumption cannot hold.
Looking at Fig. 2.105, it is hard to imagine that the dust to gas production rate ratio
from the bright, icy, area is equal to the ratio for the surroundings. The appearance of
the surface is clearly different. However, these are relatively small patches compared
to the surface area of the whole nucleus. Tenishev et al. (2016) have argued that the
dust and gas may have distinctly different production rate distributions on the
surface of 67P and this may indeed have substance. On the other hand, the introduction of a variable dust to gas production rate ratio introduces further free
parameters to fits of the gas and dust distribution in a problem that is already
under-constrained.
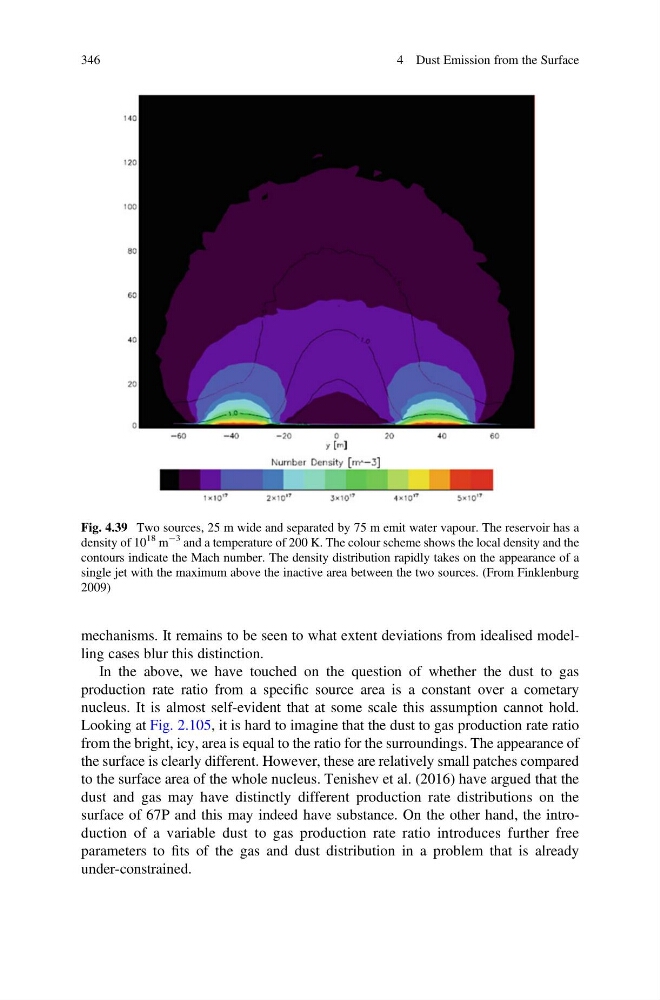
Fig. 4.39 Two sources, 25 m wide and separated by 75 m emit water vapour. The reservoir has a
density of 10
18 m
À3 and a temperature of 200 K. The colour scheme shows the local density and the
contours indicate the Mach number. The density distribution rapidly takes on the appearance of a
single jet with the maximum above the inactive area between the two sources. (From Finklenburg
2009)
346
4 Dust Emission from the Surface
In the above, we have touched on the question of whether the dust to gas
production rate ratio from a specific source area is a constant over a cometary
nucleus. It is almost self-evident that at some scale this assumption cannot hold.
Looking at Fig. 2.105, it is hard to imagine that the dust to gas production rate ratio
from the bright, icy, area is equal to the ratio for the surroundings. The appearance of
the surface is clearly different. However, these are relatively small patches compared
to the surface area of the whole nucleus. Tenishev et al. (2016) have argued that the
dust and gas may have distinctly different production rate distributions on the
surface of 67P and this may indeed have substance. On the other hand, the introduction of a variable dust to gas production rate ratio introduces further free
parameters to fits of the gas and dust distribution in a problem that is already
under-constrained.
Fig. 4.39 Two sources, 25 m wide and separated by 75 m emit water vapour. The reservoir has a
density of 10
18 m
À3 and a temperature of 200 K. The colour scheme shows the local density and the
contours indicate the Mach number. The density distribution rapidly takes on the appearance of a
single jet with the maximum above the inactive area between the two sources. (From Finklenburg
2009)
346
4 Dust Emission from the Surface